Is Healthcare Under Cyber Attack from the Inside? Using AI and Data Science to ID Cyber Risks in Healthcare.
Is Healthcare Under Cyber Attack from the Inside? Using AI and Data Science to ID Cyber Risks in Healthcare.


Over the past couple of years I've had the good fortune to help several clients in the U.S. Healthcare sector (Acute Care & Insurance) as an Interim Executive to build or build out their security and compliance programs. These programs were built not only to keep their doors locked and meet regulatory needs but also to leverage a strong security, privacy and compliance posture as a foundation to enter new markets, expand product/service offerings and to grow client bases.
One of the benefits of Management Consulting is that you get an opportunity to work with and see how various companies operate (and how they don't) across industries. But that also means that you get the chance to see the good, bad and ugly practices (or lack thereof) around security, privacy and compliance. As a generalization and in my own observance, the Healthcare Industry has and continues to have competing priorities that win out in the battle for capital investment and resources, time and time again over security investments. And let's be honest, the notion of reprioritizing $100Ks of thousands, or millions of dollars on something as tactical as interoffice or inter-VLAN firewalls can be a tough sell when competing against investments that could change health outcomes and improve lives. There's a careful balance to strike here!
So the question becomes, how can Healthcare IT, Security and/or Compliance Executives prioritize investments towards the areas of their businesses that have the most risk? Is there a better way to more ganularly prioritize investments based on a risk profile and likely threat vectors? It's with these questions in mind along with some inspiration by articles from Security thought leaders Dr. Edward G. Amoroso, CEO of TAG Cyber, LLC. and Brian Krebs, of Krebs on Security that I decided to investigate further. Developing ideas and hypothesis into a brief research study that leveraged Open Source Big Data, AI and Data Science to inform IT, Security and Compliance practitioners how they may best focus scarce resources (Time & Capital). That research follows below:
Research Overview
As the world continues to rapidly and exponentially adopt information technology and digital services to drive the global economic engine, the data, intelligence and ultimately the knowledge gleaned from these technologies has become a new currency. As data increases in value (monetary, as well as a source of influence), so too does the interest of unscrupulous actors in exploiting it for their own purposes.
The defense of this information has become a new borderless warfront, fought by both public and private institutions where like in physical warfare, there’s times that only the views and framing of good vs. evil differ, as the actors range from low level independents, (script kiddies), all the way to nation states who wage concurrent offensive and Cyber defense war.
This makes information security (Cyber) a critical piece of managing risks, yet there’s little information sharing and coordination of intelligence amongst and across both public and private institutions. The Vocabulary for Event Recording and Incident Sharing (VERIS) is one measure that is designed to help bridge these gaps. This data set is designed to provide a common language for describing Cyber incidents in a structured and repeatable manner. VERIS is a response to one of the most critical and persistent challenges in the security industry, a lack of quality information. VERIS targets this problem by helping organizations to collect useful incident related information and to share that information anonymously and responsibly with others. The overall goal of VERIS is to lay a foundation from which constructive and cooperative learnings can better measure and manage risk.
Research Background
Leveraging the VERIS database as a data source inclusive of a 13-year period from 2004, through 2017, it’s hypothesized in this research that various commercial industries face differing Cyber risks. Those risks are spawned from differing sets of actors based upon each industry’s unique intrinsic characteristics and value of their data. More specifically this research hypothesizes the following:
Research Problem
Insider threats pose a particular challenge to private, commercial industries. It’s the very same insiders that are required to operate their businesses that:
Hypothesis
H0= The Healthcare Industry over the period covered faces the greatest threat of insiders as nefarious actors. These insiders attempt and successfully exploit the industry resulting in known or suspected data breaches equal to or greater than a factor of 2 (100%) over its peer industries.
Alternative Hypothesis
HA= The Healthcare Industry over the period covered faces the greatest threat of insiders as nefarious actors. These insiders attempt and successfully exploit the industry resulting in known or suspected data breaches less than a factor of 2 (100%) over its peer industries.
Objectives of this Research
General Objectives
With scarce resources of time and capital available in today’s healthcare industry, this research is meant to provide an additional vehicle by which to inform executive investment strategies and priorities for information security protections of healthcare firms.
Specific Objectives
The generation of actionable information and insights from historical data breach data analysis to inform CISO, CIO and CCO executives within the Healthcare Industry to help them prioritize their information security investment plans, as part of greater enterprise risk assessment strategy.
Scope and Limitations
This research represents a small portion of the overall information security risks that any firm, in any industry faces with respect to the risk of data breaches. This is especially true in the healthcare industry, which is made up of various interdependent industries and entities. This research and the insights gleaned should not be assumed all-encompassing or comprehensive with respect to defining an enterprise risk management plan. These findings relate specifically to the occurrence or likelihood of security breaches leading to data compromise. These findings are not necessarily indicative of attacks, nor impact, nor general security incidents, nor the overall enterprise risk of a security breach.
The data analyzed, and insights generated as part of this report is limited to the U.S. Market. Outside of this market variances may exist with respect to risks, historical breach trends and the actors that may be involved. As a result, global insights or specific market insights outside of the U.S. cannot nor should be derived.
Research Strategy
Data mining, statistical and visual analysis was performed on the Vocabulary for Event Recording and Incident Sharing (VERIS) VERIS Community Database (VCDB), which aims to collect and disseminate data breach information for publicly disclosed data breaches (Vz-risk, 2018).
Sources of Data
This data is made public via a creative commons license and freely available on GitHub.com to download and analyze (Vz-risk, 2018). Data sources include the U.S. Department of Health and Human Services (HHS) incidents, and various Attorneys Generals that provide breach notification source documents, as well as media reports and press releases. “This data is currently biased towards the Health sector since nearly half of the incidents came from HHS publications. Subsequent updates have brought the dataset to over 3,600 incidents coded”(Verizon Security Research & Cyber Intelligence Center., 2018).
Sampling Techniques
In order to validate or invalidate the hypothesis posed as part of this research, a combination of stratified and clustered (aka. multistage) sampling was used. Tooling to perform this sampling was a combination of Google Sheets, Microsoft Excel for data wrangling and an open source big data, data science package called DataIku (DataIku., 2018). With the addition of big data analysis tooling, the possibility of analyzing full datasets, in this case 8337 records, was possible and full population analysis was performed in some situations, vs. a sampling technique, to both improve data accuracy and remove sampling error and some chances for bias.
Statistical Treatment of Data
Descriptive and inferential statistics, multivariate regression analysis, augmented by machine learning techniques of Random Forest tree predictors, including tree response as an estimate of the dependent variable given the predictors, complemented by Extreme Gradient Boosting was used to analyze the data.
Descriptive Statistics
More specifically with respect to the descriptive statistics observations made, which the observations are clustered around a central location as described by the central tendency and the spread towards the extremes is described by the degree of dispersion.
Inferential Statistics
From an inferential statistics standpoint, data was analyzed from samples to make inferences in the larger collection of the population. Doing so to answer or test the hypotheses. Probability was derived to measure the likelihood that an event, in this case the hypothesis will occur. Additionally, the Pvalue (or the calculated probability) was also derived, as the probability of the hypothesis event occurring by chance if the null hypothesis is true.
Regression Analysis
Multivariate regression analysis was used after deriving the Linear regression that minimizes the distance between the fitted line and all of the data points, developing a Goodness of fit test. “Technically, ordinary least squares (OLS) regression minimizes the sum of the squared residuals, centered around the squared residuals.” In support of the Goodness of fit testing, the R2statistical measure was derived as the coefficient of determination for multiple regression (Frost, 1970).
Machine Learning
Machine learning was utilized for its powerful ability to analyze vast amounts of data and make forward looking predictions based upon statistical analysis of historical data. Specifically, in this research, XGBoost (Extreme Gradient Boosting) training methods was used, where the term “Gradient Boosting” as proposed in the paper Greedy Function Approximation: A Gradient Boosting Machine, by Friedman (2001). XGBoost is based on this original model. XGBoost is used for supervised learning problems, where it was used for training data (with multiple features) xito predict a target variable yi. From there, Random Forest Tree Predictors were derived as a collection or ensemble of simple tree predictors, each capable of producing a response when presented with a set of predictor values. For regression analysis, tree response is used as an estimate of the dependent variable given the predictors.
Research Findings
Descriptive Statistics Analysis
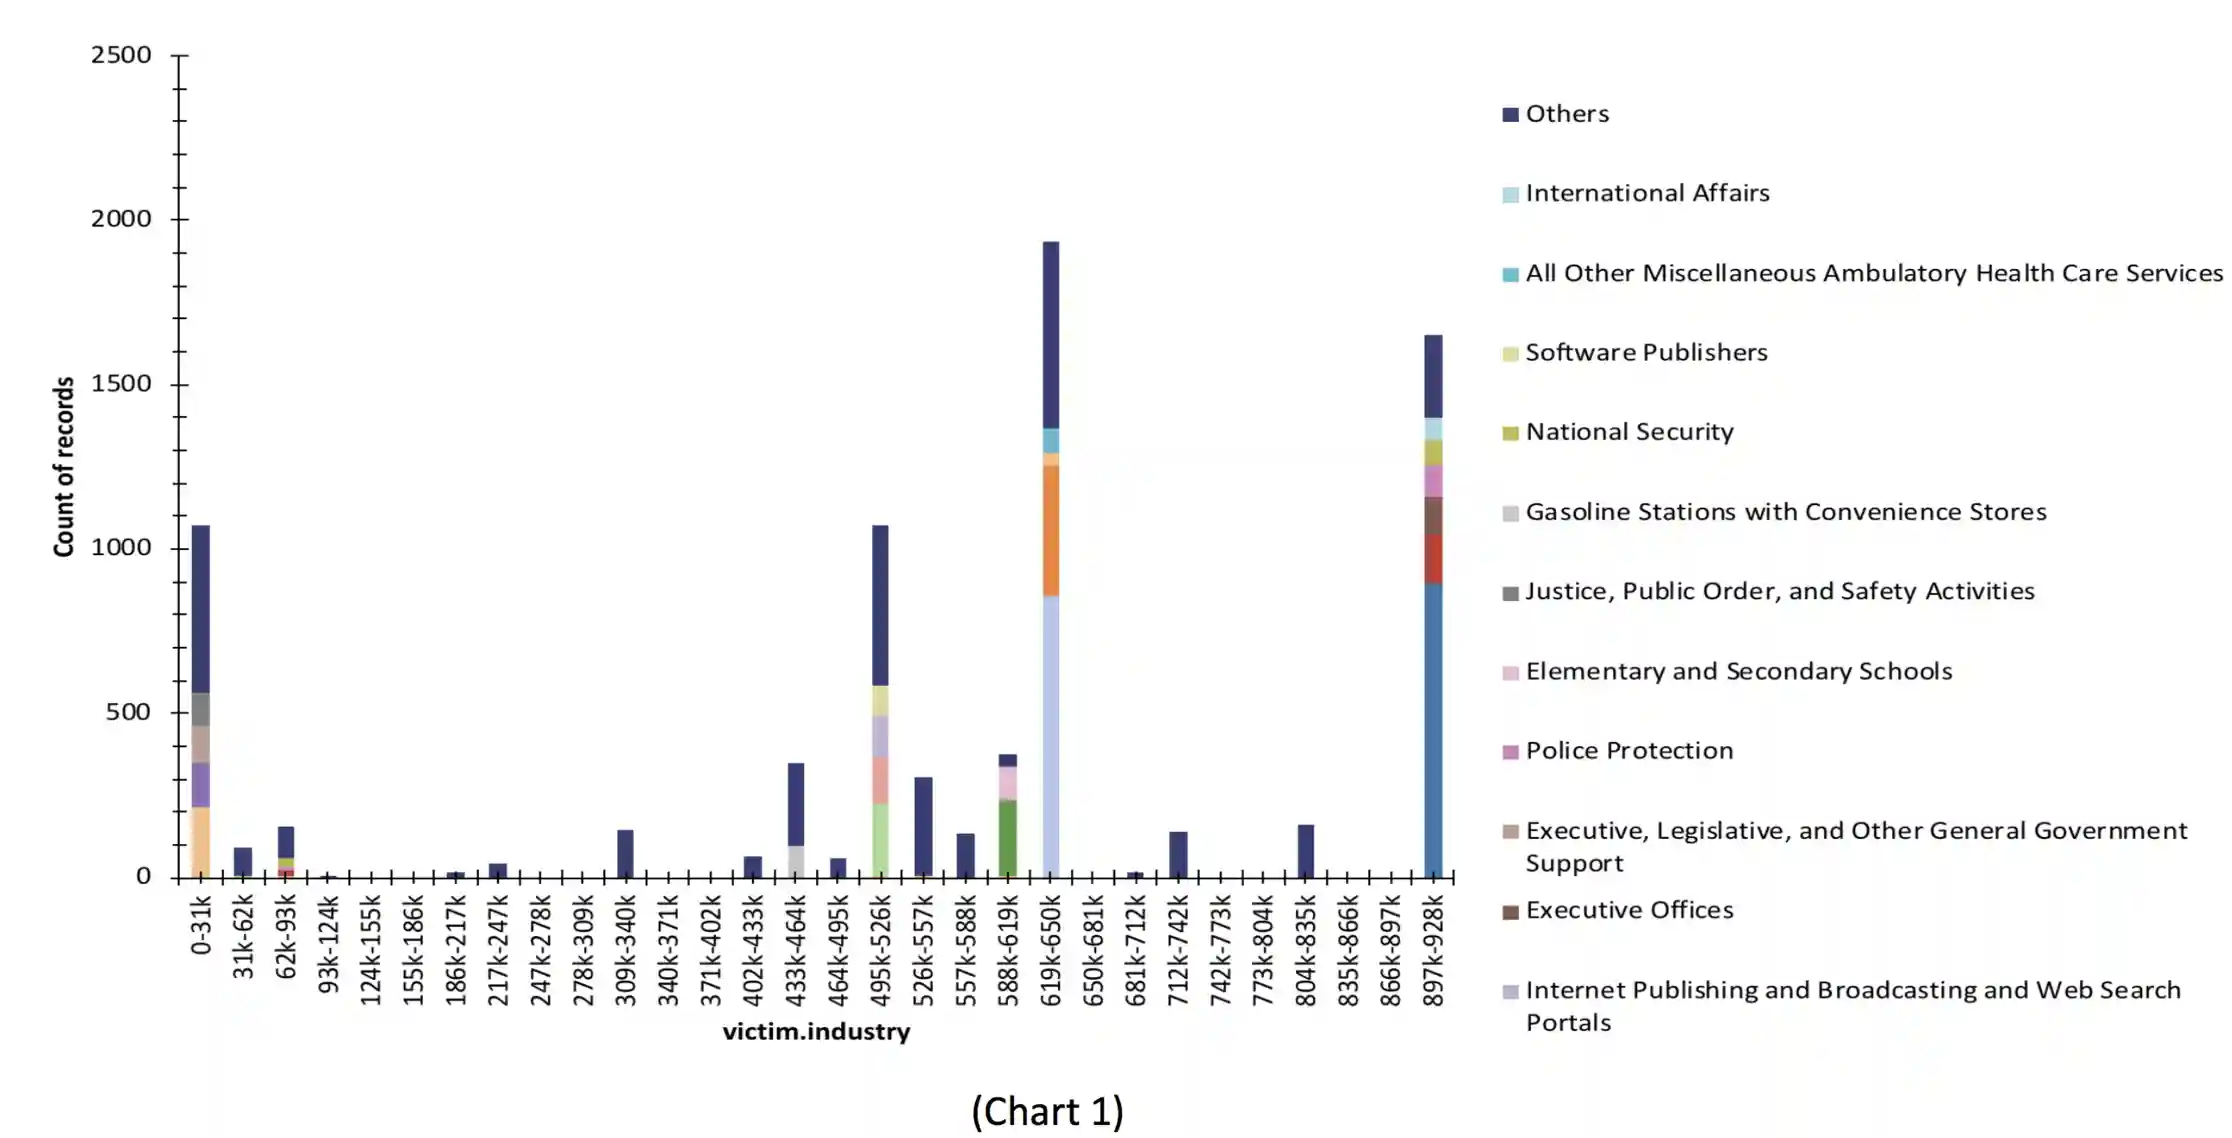
Analyzing the quantitative data, the breach data falls into the classification of categorical data, quite nicely following NAICS Association industry coding as seen in Appendix A. Where the Healthcare Industry is represented by the coding of 62xx (NAICS, 2012) seen in Chart 1.
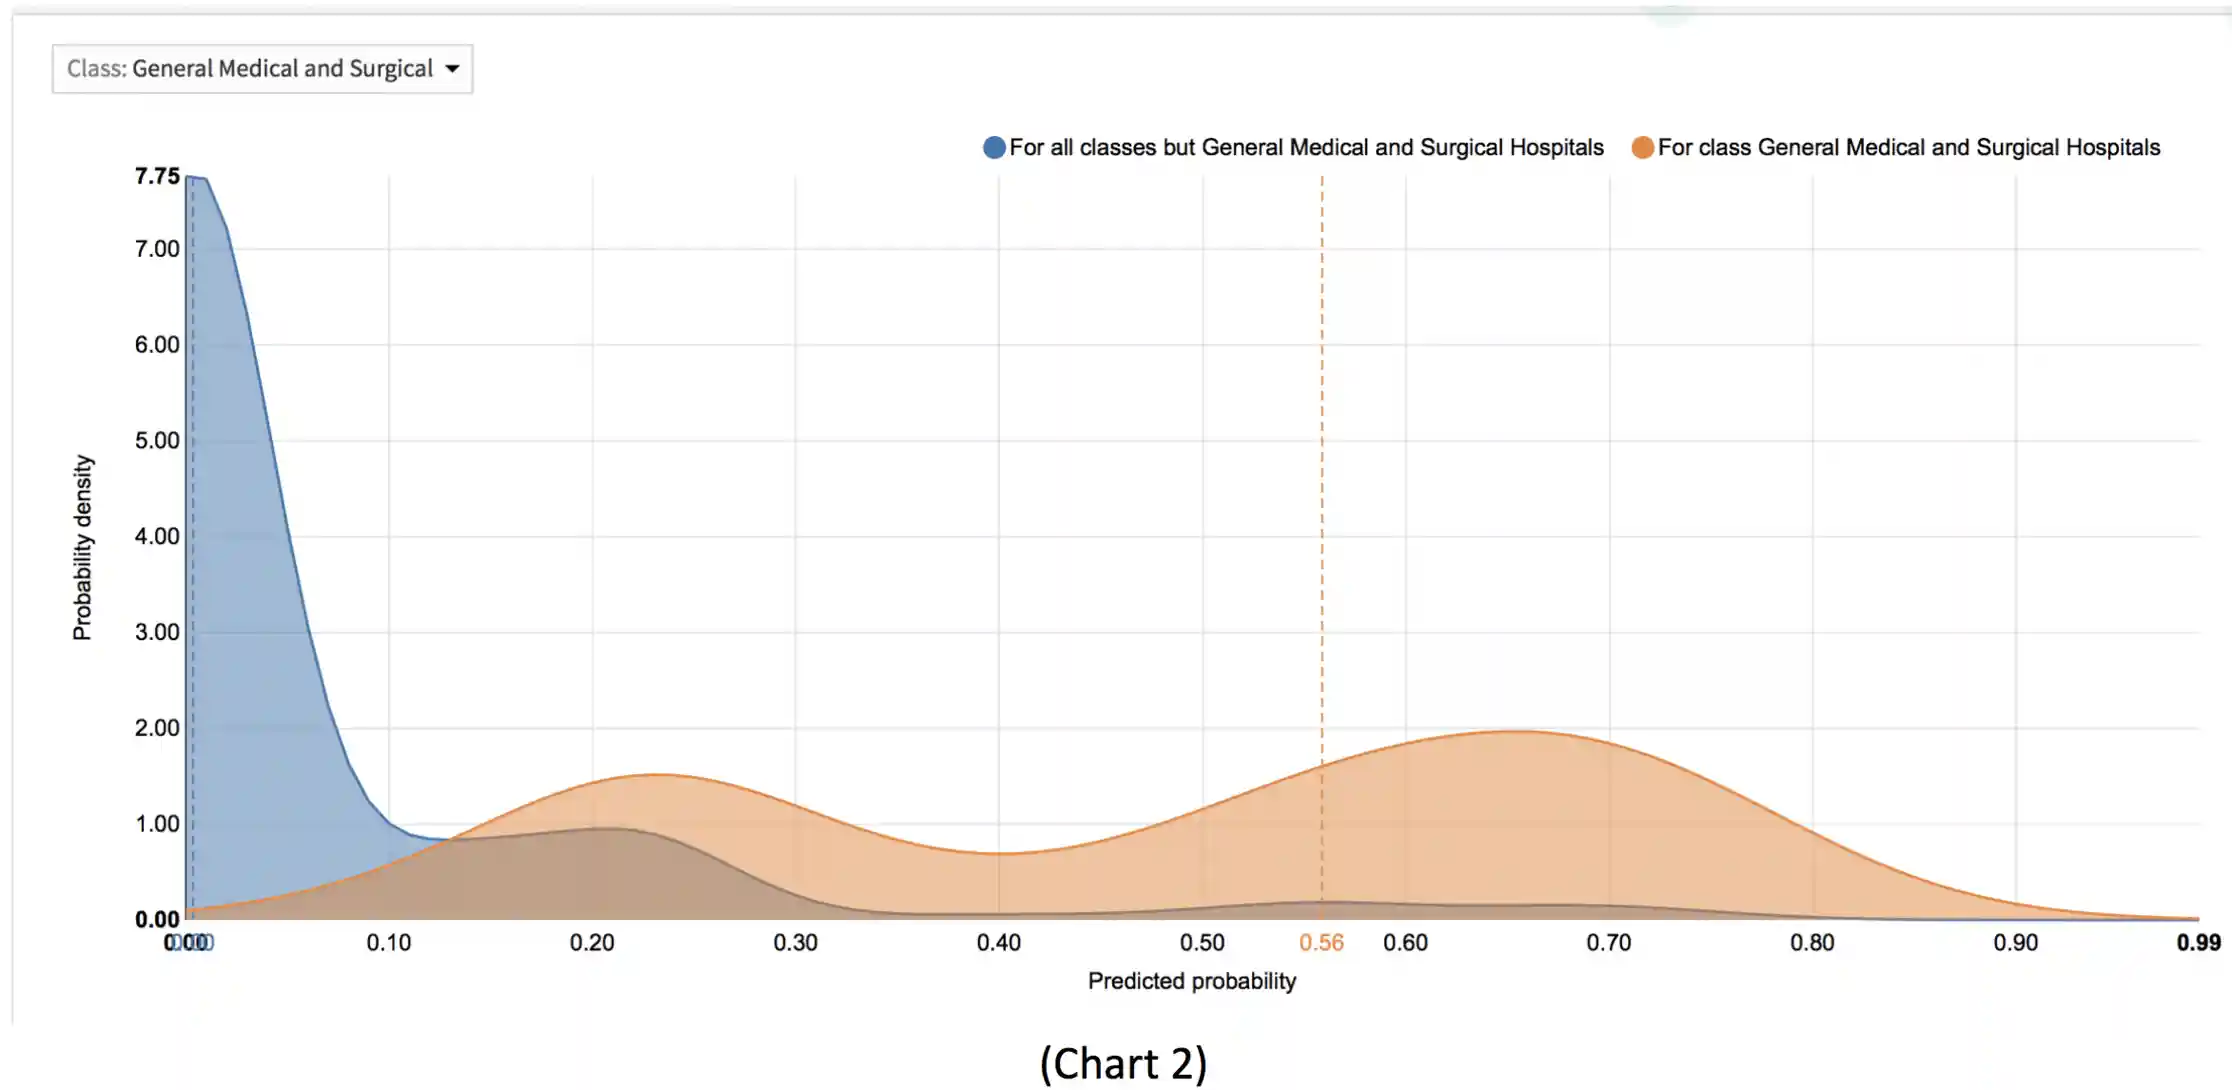
Further analysis via a probability density can be seen in Chart 2, showing the probability of Healthcare entities being breached over their peer industries details a roughly 5xmore likely victim of data breach over the mean average of its industry peers.
Inferential Statistics
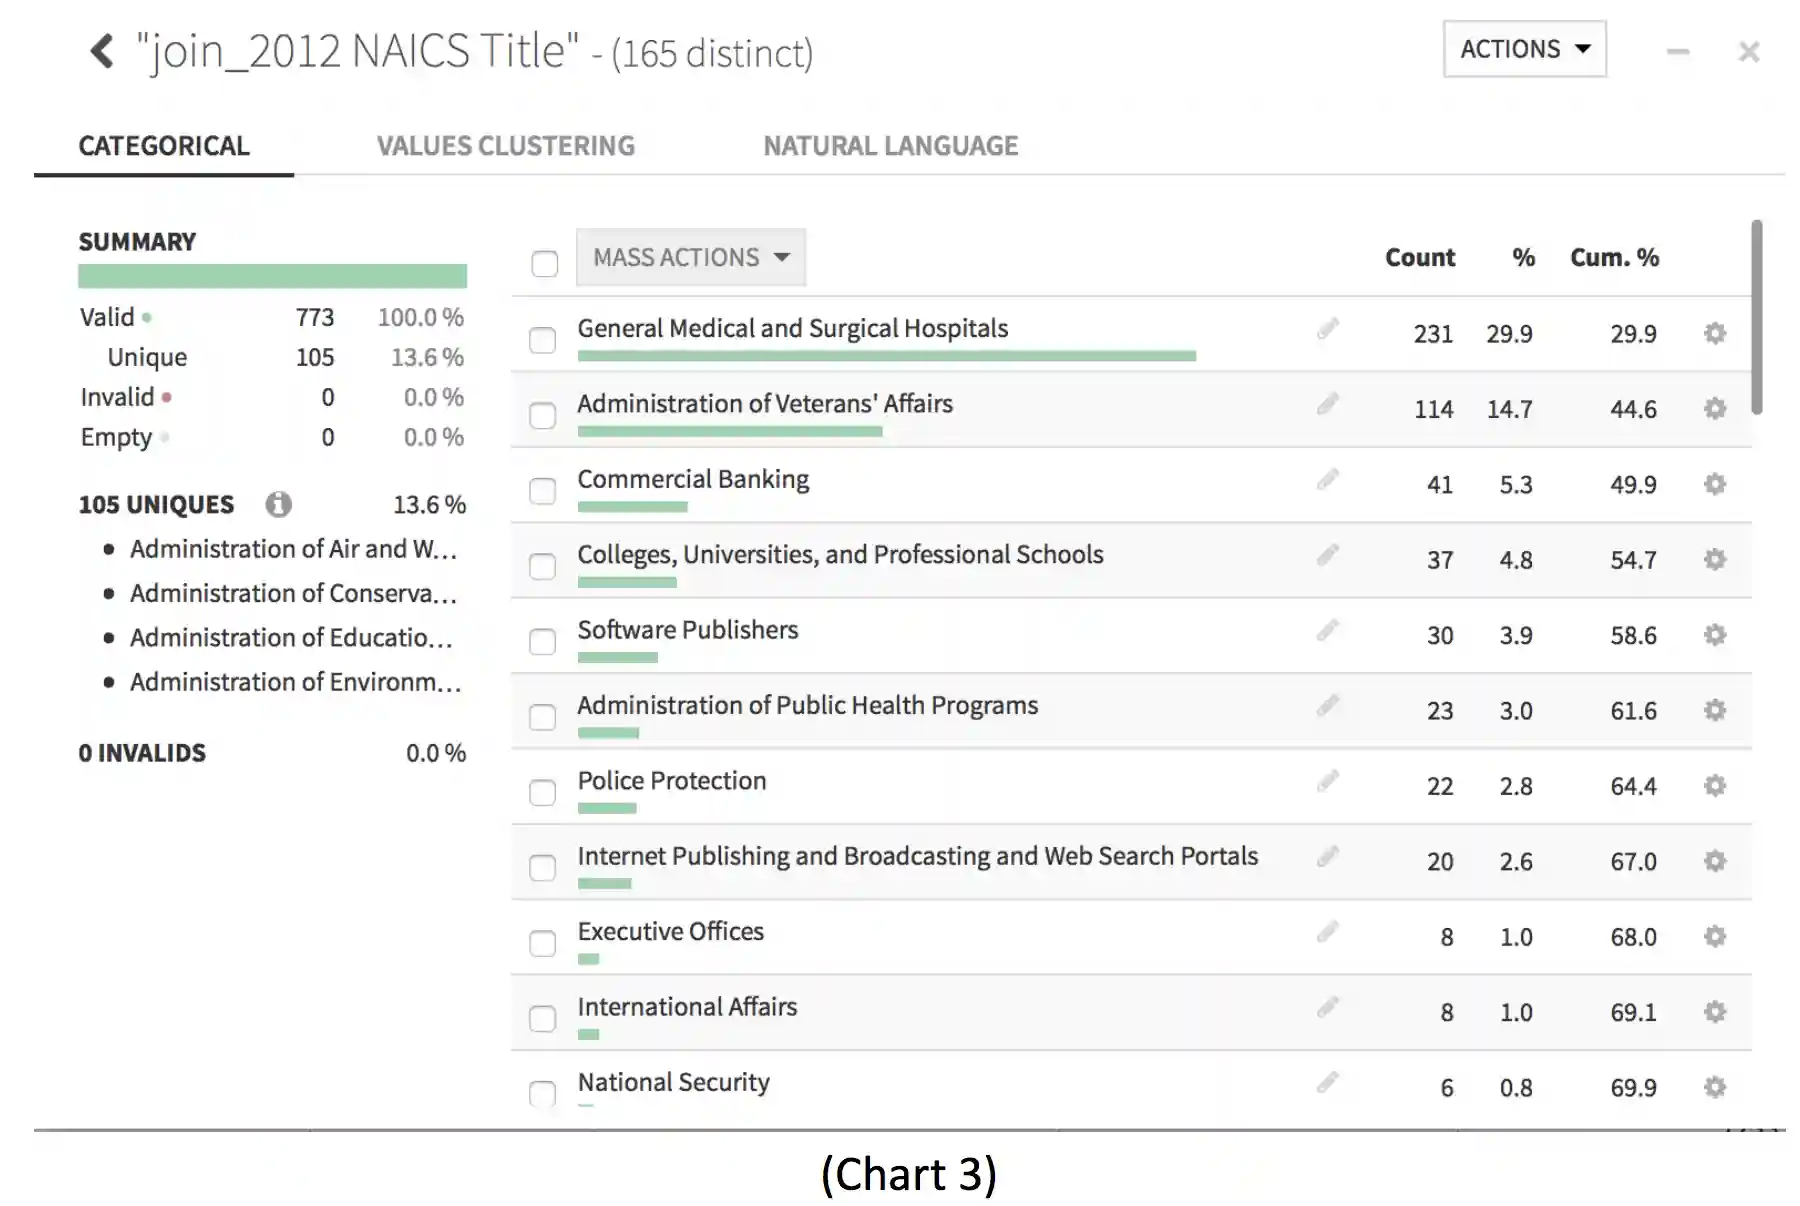
Using inferential analysis of the industry segmentation of breaches or likely breaches, here we can see that there is immediately a right skewed model towards healthcare entities. leveraging the Histogram and Distribution Graphing of categorical data as detailed in the Chart 3:
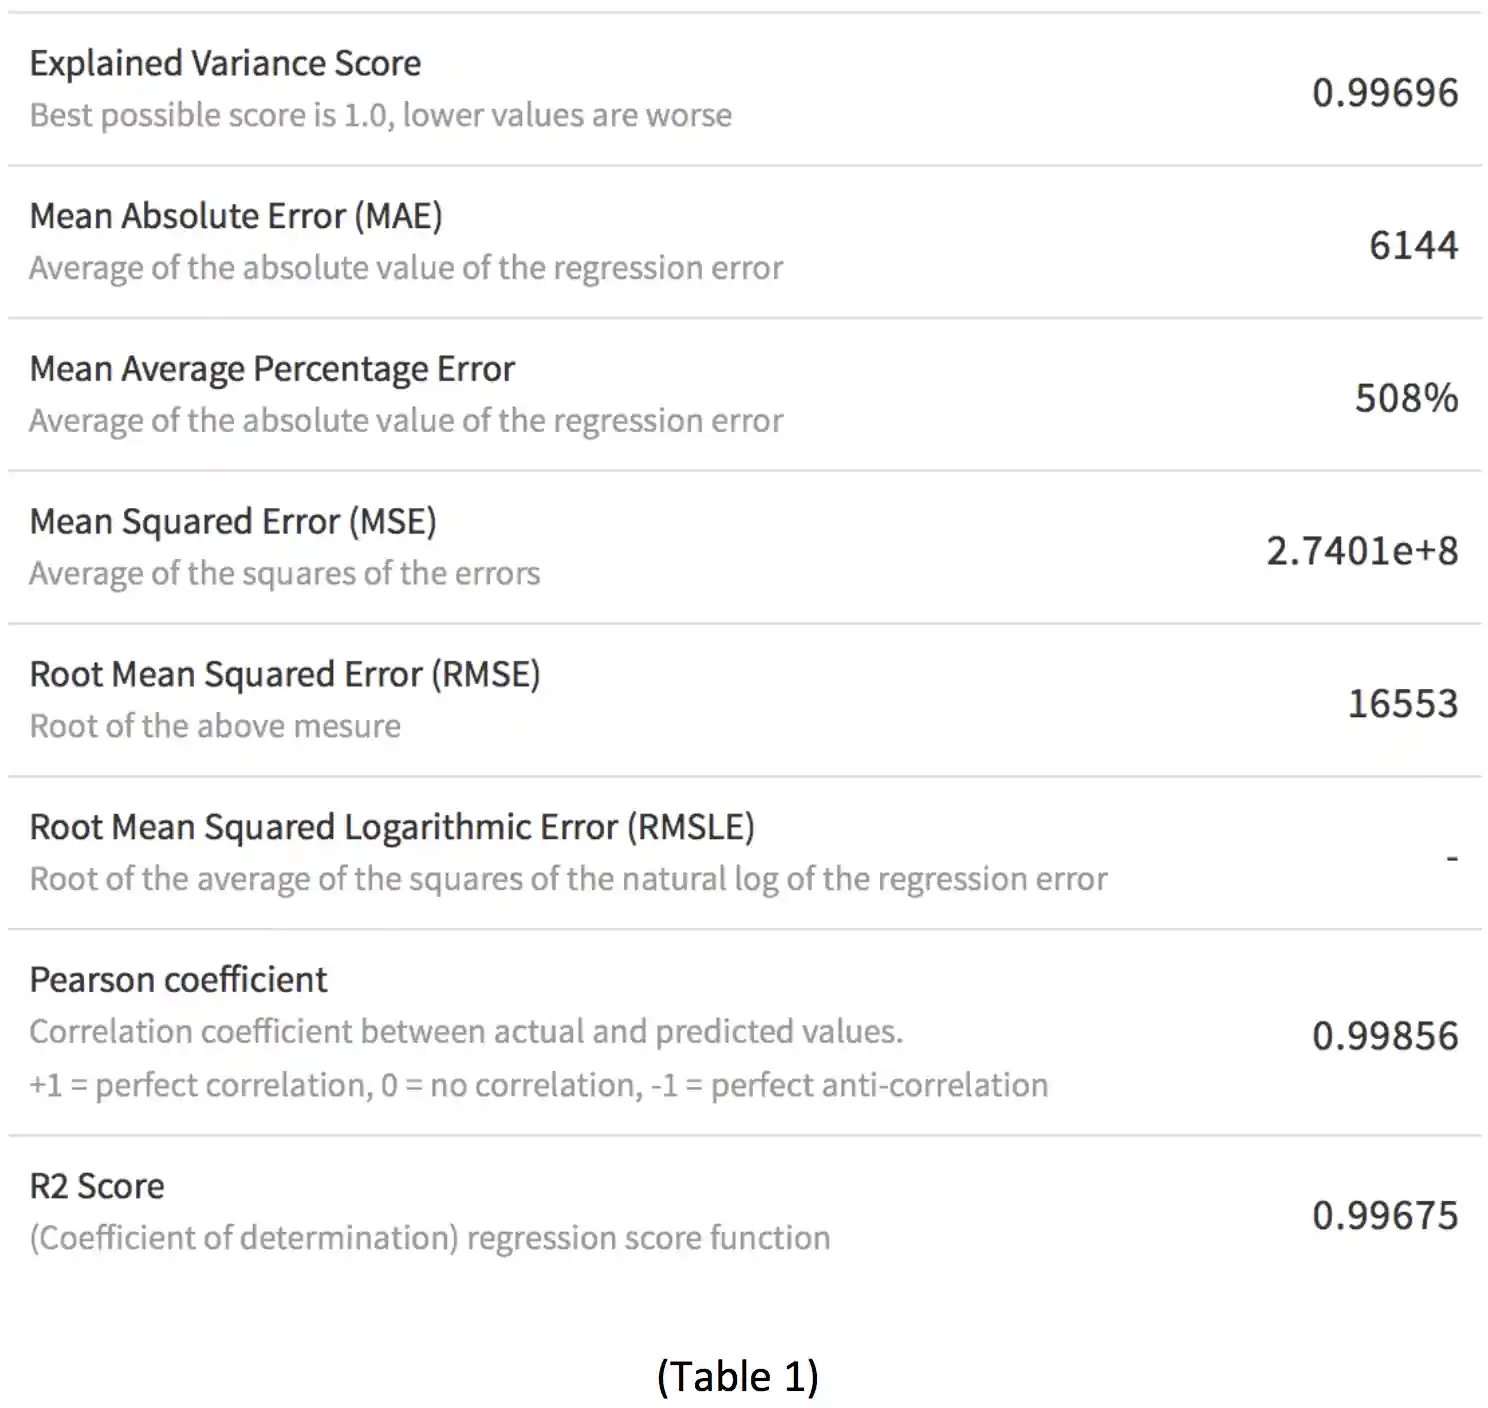
Computing the aforementioned P-value in Table 1 that with the H0 hypothesis having a P= 0.99856, there’s a near perfect correlation between the predicted and actual values in the hypothesis.
Regression Analysis
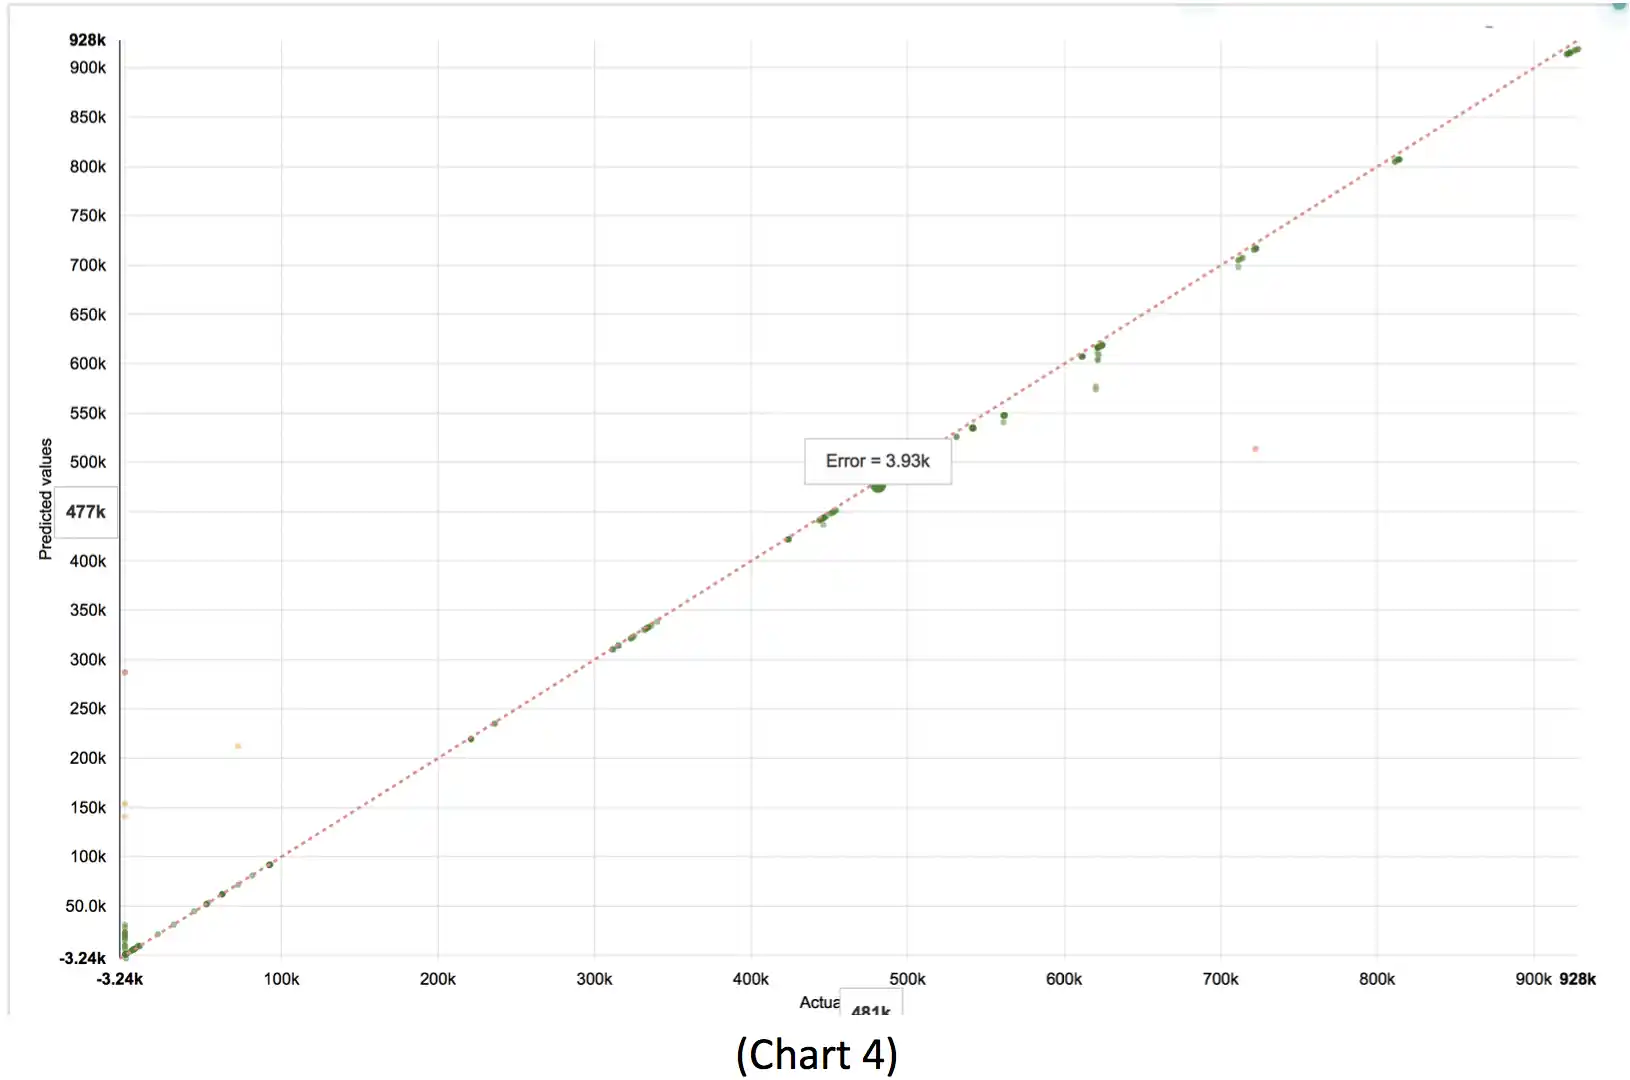
Regression analysis of breach victim data including the computation of a R2 statistical measure (Table 1), derived as the coefficient of determination for multiple regression. The R2 value of 0.99675 coefficient of determination closely mirrors the findings of the P-value, nearing perfect fit to H0. A visual analysis of this data plotted on a Chart 4 confirms the close fit testing detailed by the R2 value.
Machine Learning and Forecasting
As noted earlier in this paper, the capabilities of big data analysis and decision support tools, enhanced by machine learning have allowed for this respectfully small population dataset of 8377 rows to be fully analyzed. Considering that this data population is itself a subset of overall data breaches, known or otherwise within the U.S. Excluding the previously mentioned biases, still allows for useful inferences of the risks to data breach across the broader U.S. private industry landscape.
Tree boosting is a highly effective and widely used machine learning method. In this paper, it's described as a scalable end-to-end tree boosting system called XGBoost. Which is used widely by data scientists to achieve state-of-the-art results on many machine learning challenges. XGBoost was used to train the data prediction model to forecast the occurrence of future forecasts of security incident and data breach predictions, based on the historical analysis of the same from the VERIS dataset.
Much like the P-value and R2 calculations had identified previously, XGBoost forecasts a near perfect 0.997 fit with the hypothesized model, as seen in Chart 5.
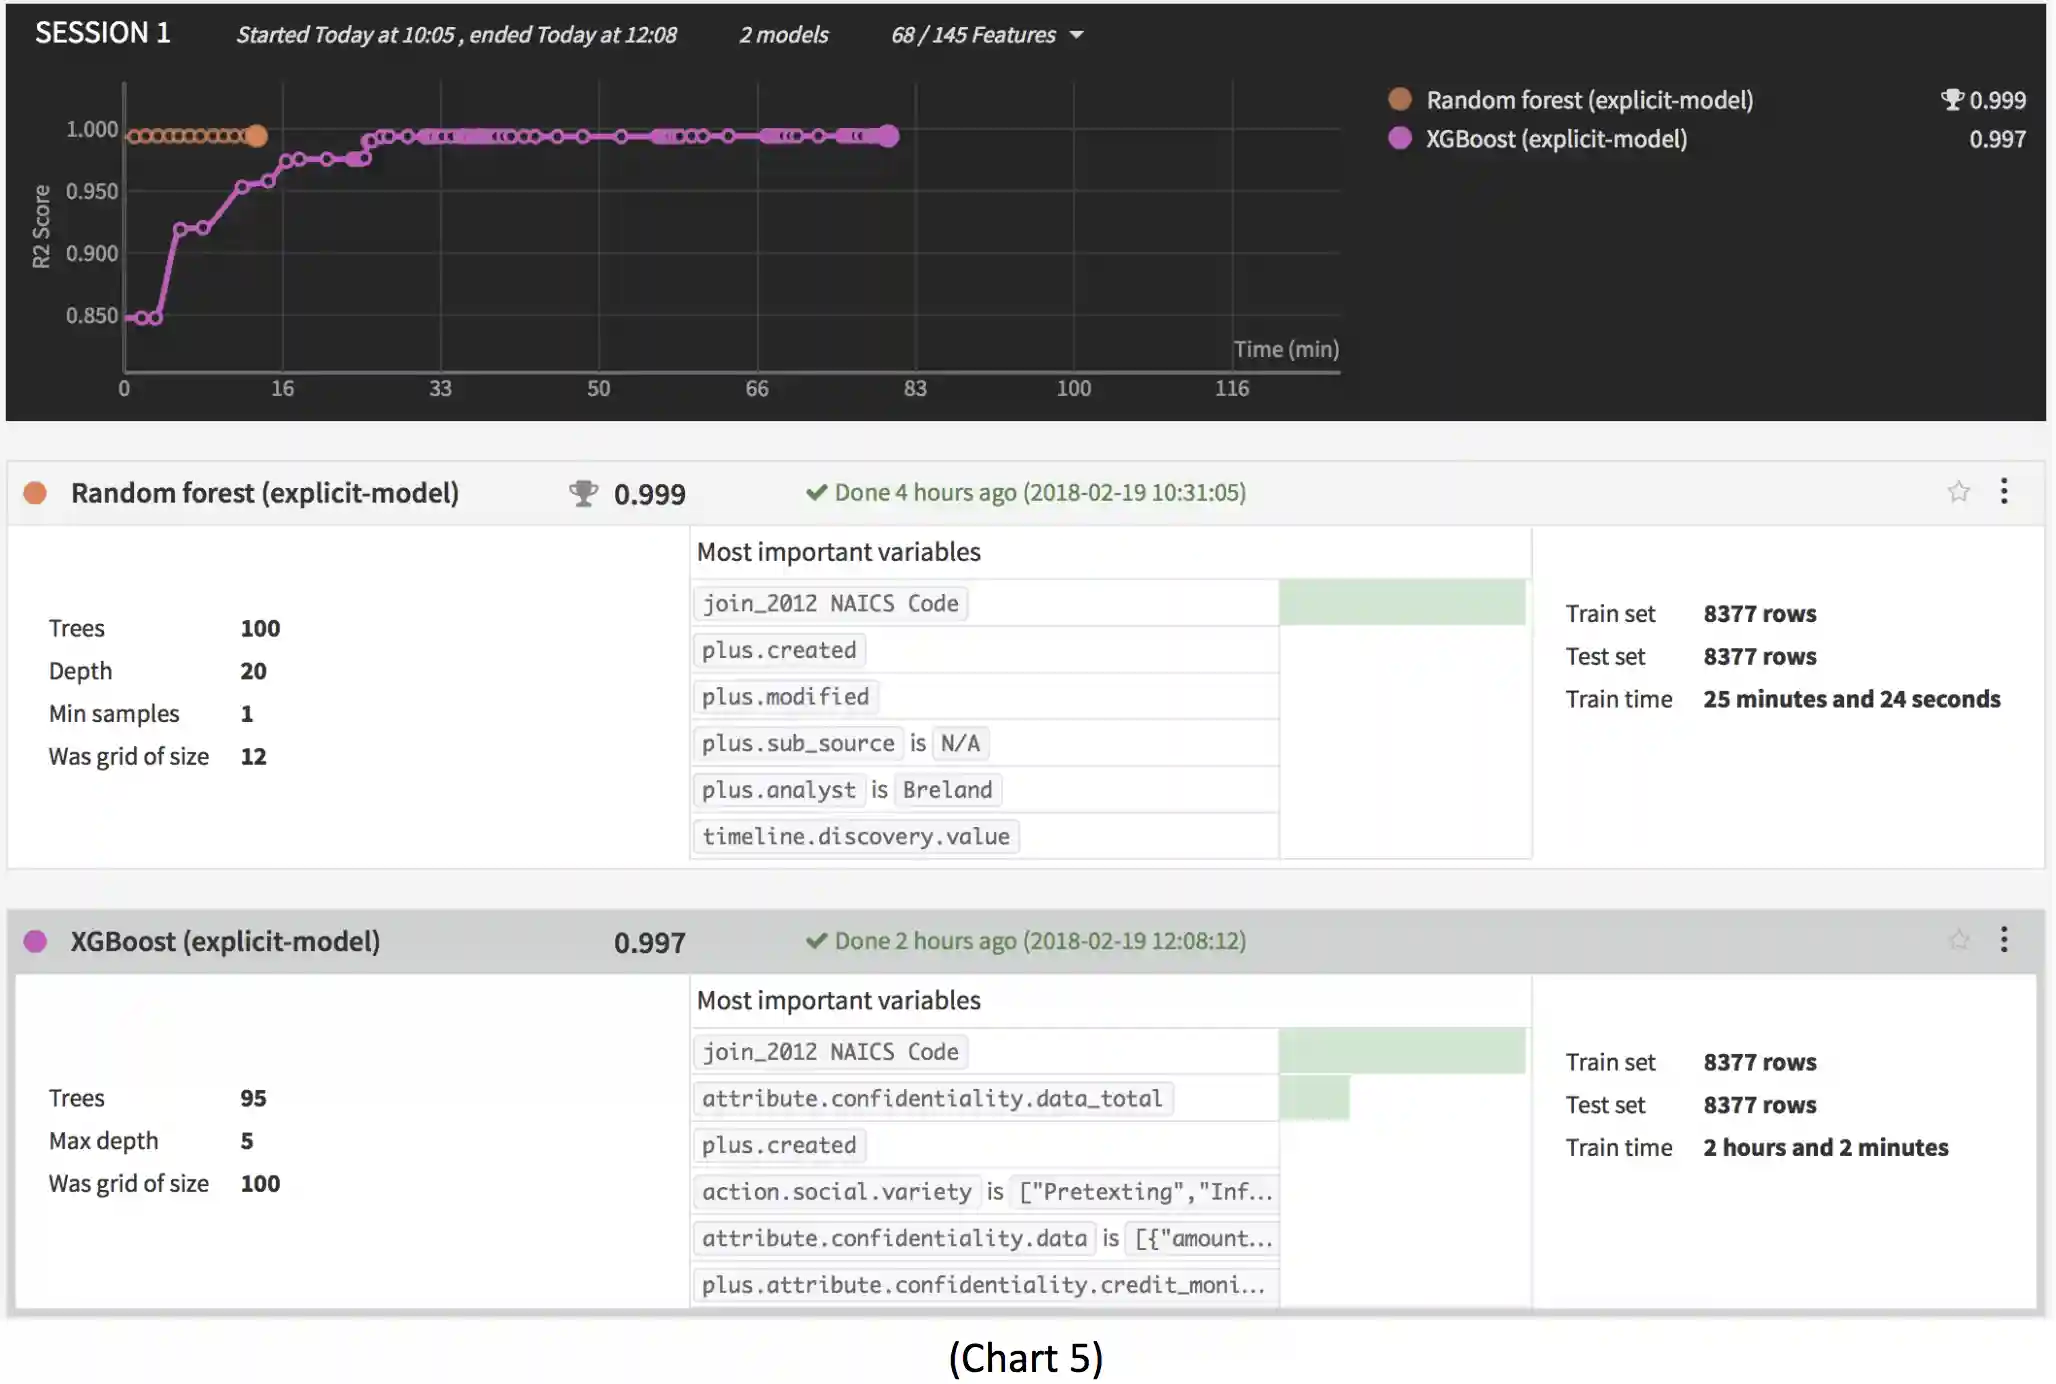
Similarly, the Random Forest predictor model, also detailed in Chart 5, shows in particular that the procedure is consistent and adapts to sparsity, in the sense that the data’s rate of “convergence depends only on the number of strong features and not on how many noise variables are present” (Lepetit & Fua, 2013), as seen in Chart 6.

Conclusion
Research data results and analysis, combined with the threat actor source identification, indicates that 68% of the threats in the VERIS database covering the 13-year period from 2004, through 2017 are internal threats within Healthcare. When compared against the next closest sector for Internal Actor derived Data Incident and Breach, the Public Sector; and normalizing for exceptions created by the U.S. Office of Personnel Management’s (OPM) data breaches in 2012 and 2015 (U.S. OPM, 2015) that create outliers, the public sector results in 29.24% of its security incidents from insider threats.
Thus, the strong correlation provided by the descriptive, inferential and regression statistical analysis all prove the H0 hypothesis to be valid. Combined with the machine learning forecasted future predictions, once again holding true. This research holds the H0 hypothesis to be valid and invalidating the HA alternative. In other words, the Healthcare Industry has faced and is likely to continue to face at least 2x’s the number of security incidents and data breaches from insider threats than its peer industries.
References
DataIku. (2018). How Does Dataiku Connect to Your Data Sources? Retrieved February 21, 2018, from https://www.dataiku.com/dss/features/connectivity/
DIXIT, A. (2017). ENSEMBLE MACHINE LEARNING; A BEGINNERS GUIDE THAT COMBINES
POWERFUL MACHINE LEARNING ALGORITHMS TO BUILD OPTIMIZED MODELS(Vol. 1). S.l., NY: PACKT PUBLISHING.
Friedman, J. M. (2001, April 19). Greedy Function Approximation: A Gradient Boosting
Machine. Retrieved February 25, 2018, from https://statweb.stanford.edu/~jhf/ftp/trebst.pdf
Frost, J. (1970, May 30). Regression Analysis: How Do I Interpret R-squared and Assess the Goodness-of-Fit? Retrieved February 25, 2018, from http://blog.minitab.com/blog/adventures-in-statistics-2/regression-analysis-how-do-i-interpret-r-squared-and-assess-the-goodness-of-fit
Lepetit, V., & Fua, P. (2013). Keypoint Recognition Using Random Forests and Random Ferns. Decision Forests for Computer Vision and Medical Image Analysis,111-124. doi:10.1007/978-1-4471-4929-3_9
NAICS. (2012). NAICS Identification Tools. Retrieved February 25, 2018, from https://www.naics.com/search/
U.S. OPM. (2015). Cybersecurity Resource Center Cybersecurity Incidents. Retrieved February 25, 2018, from https://www.opm.gov/cybersecurity/cybersecurity-incidents/#WhatHappened
Verizon Security Research & Cyber Intelligence Center. (2018, January 17). THE VERIS COMMUNITY DATABASE (VCDB). Retrieved February 21, 2018, from http://veriscommunity.net/vcdb.html
Vz-risk. (2018, January 17). The VERIS Community Database. Retrieved February 21, 2018, from https://github.com/vz-risk/VCDB/blob/master/data/joined/vcdb.json.zip
Appendix A - NAICS Industry Code Listings
© 2021 Mesh Digital LLC, ALL RIGHTS RESERVED