Using Data Science and Machine Learning to predict the Economic Health of Small Island Developing Economies (SIDEs).
Using Data Science and Machine Learning to predict the Economic Health of Small Island Developing Economies (SIDEs)


The fourth industrial revolution is upon us. "Previous industrial revolutions liberated humankind from animal power, made mass production possible and brought digital capabilities to billions. The Fourth Industrial Revolution (4IR) is, however, fundamentally different. It is characterized by a range of new technologies that are fusing the physical, digital and biological worlds, impacting all disciplines, economies and industries, and even challenging ideas about what it means to be human” (Schwab, 2017).
However, the 4IR isn’t necessarily going to be equitable across all parts of the globe. Nations and economies in the developing world won’t necessarily be well positioned to participate and thrive in this new era. This post attempts to use cutting edge data science, artificial intelligence (AI), and machine learning (ML) technologies to forecast the economic health of small island developing economies, while not losing the irony of using 4IR tools and their juxtaposition to model and predict the economic health of nations that may be at a disadvantage in this next industrial revolution.
Executive Summary
On a macro level, the travel and tourism (T&T) industry, post-World War II has emerged as a global leading economic market sector, contributing to a significant portion of the global gross domestic product (GDP) (Mcelroy & Parry, 2010). The World Travel and Tourism Council (WTTC)places the T&T industry “at 9.1% of global GDP, Travel & Tourism, which[sic] generates more economic output than the automotive manufacturing (7.9%), mining (8.0%) and chemicals manufacturing (9.0%)”industries (The Comparative Economic Impact of Travel & Tourism., 2012).
Yet at a more microscopic level, small island developing economies (SIDEs) who’s economic health is explicitly tied to the T&T industry are vulnerable, with unique challenges. The vast majority of SIDE economies are built upon the consumption and exploitation of natural resources, which are second to none for their beauty, biodiversity and benefits to mankind. Additionally, SIDEs have a material portion of their local residents living in poverty, while the T&T industry prospers as a whole (Barbara, V. T. (2005). This research would like to contemplate the future sustainability of these economies, by forecasting SIDE nation T&T contributions as a percent of GDP to forecast SIDE economic viability.

The data set for analysis by this research is grounded in published open economic data by the World Economic Forum (WEF) and the World Bank. WEF is an international non-governmental organization (NGO) that was founded to further public, private collaboration in support of the development and expansion of the global economy (WEF, 2018). The World Bank Group is a holding company comprised of five operating companies that act in concert to be one of the world’s largest funding and knowledge, committing to reducing poverty, increasing shared prosperity and sustainable development (The World Bank, 2018). The economic data used as the basis of this research accounts for the percent of GDP that the T&T industry contributes for 176 countries, spanning a 22-year period from 1995-2017 (WTTC, 2018). This raw data was cleansed using Microsoft Excel. Processed using data science software from software vendor DataIku. Supervised machine learning (ML) algorithms including random forest, gradient boosted trees, logistic regression, XGBoost, and decision tree were used to define the best predictor of future T&T GDP estimates. Finally, the outputs of the predictive modeling were used as inputs to forecast for the next 24 months the T&T contributions to GDP using R programming and plotted as data visualizations for ease of interpretation.
Method
Data cleansing
The raw data retrieved from the World Bank included multiple dimensions of data with respect to T&T related economic indicators that were unnecessary for this research. This included dimensions around business, leisure and governmental economic contributions. As well, as domestic travel, visitor exports, and capital investments in T&T. Microsoft Excel was used to filter and extract the T&T aggregate economic contributions to GDP represented as a percent of total GDP in normalized in real U.S. Dollars (USD). The DataIku DSS software suite was used to further clean the data, refining nominal categorization and discrete, numerical data.
Data Preparation
The cleansed data was ingested into a data pipeline to process through various machine supervised learning algorithms to compare and contrast the best fit model for the time series data under research evaluation. Supervised learning was used in this use case, leveraging the rich, validated 22 years of GDP data provided by the WEF and World Bank, increasing the chances of reliable future T&T forecast predictions (Castle, 2017). Receiver operating characteristics (ROC) was used as a relatively accurate metric for comparison of the efficacy of machine learning models. ROC can be helpful in situations such as this to assess predictive behaviors of supervised ML models while being independent of confidence ratings and/or class distributions. The results of these ROC calculations compared five leading ML algorithms as seen in Figure 1 where the logistic regression algorithm proved to be the most reliable model for this research as measured against the ROC quality measures in Table 1.
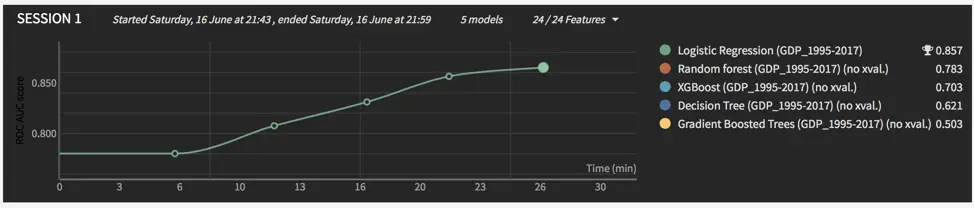
Figure 1: Machine Learning Outcomes as Measured by ROC
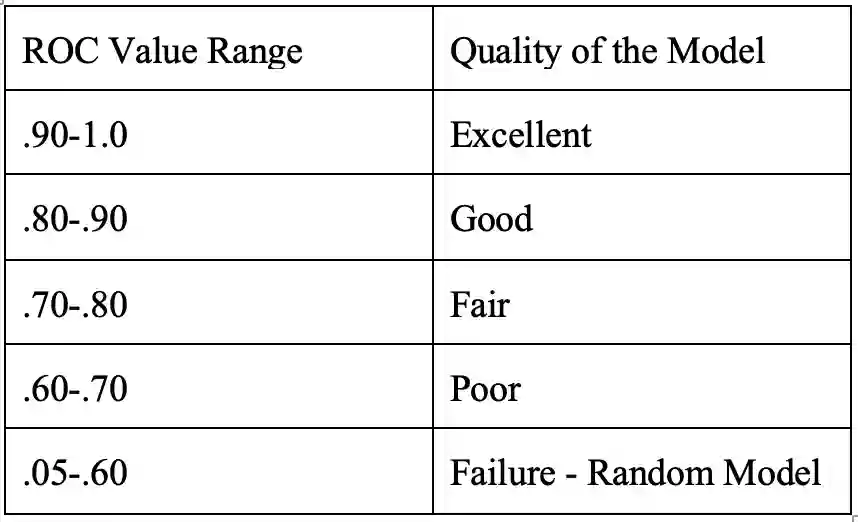
Table 1: ROC Area Under the Curve Quality Measures
Results
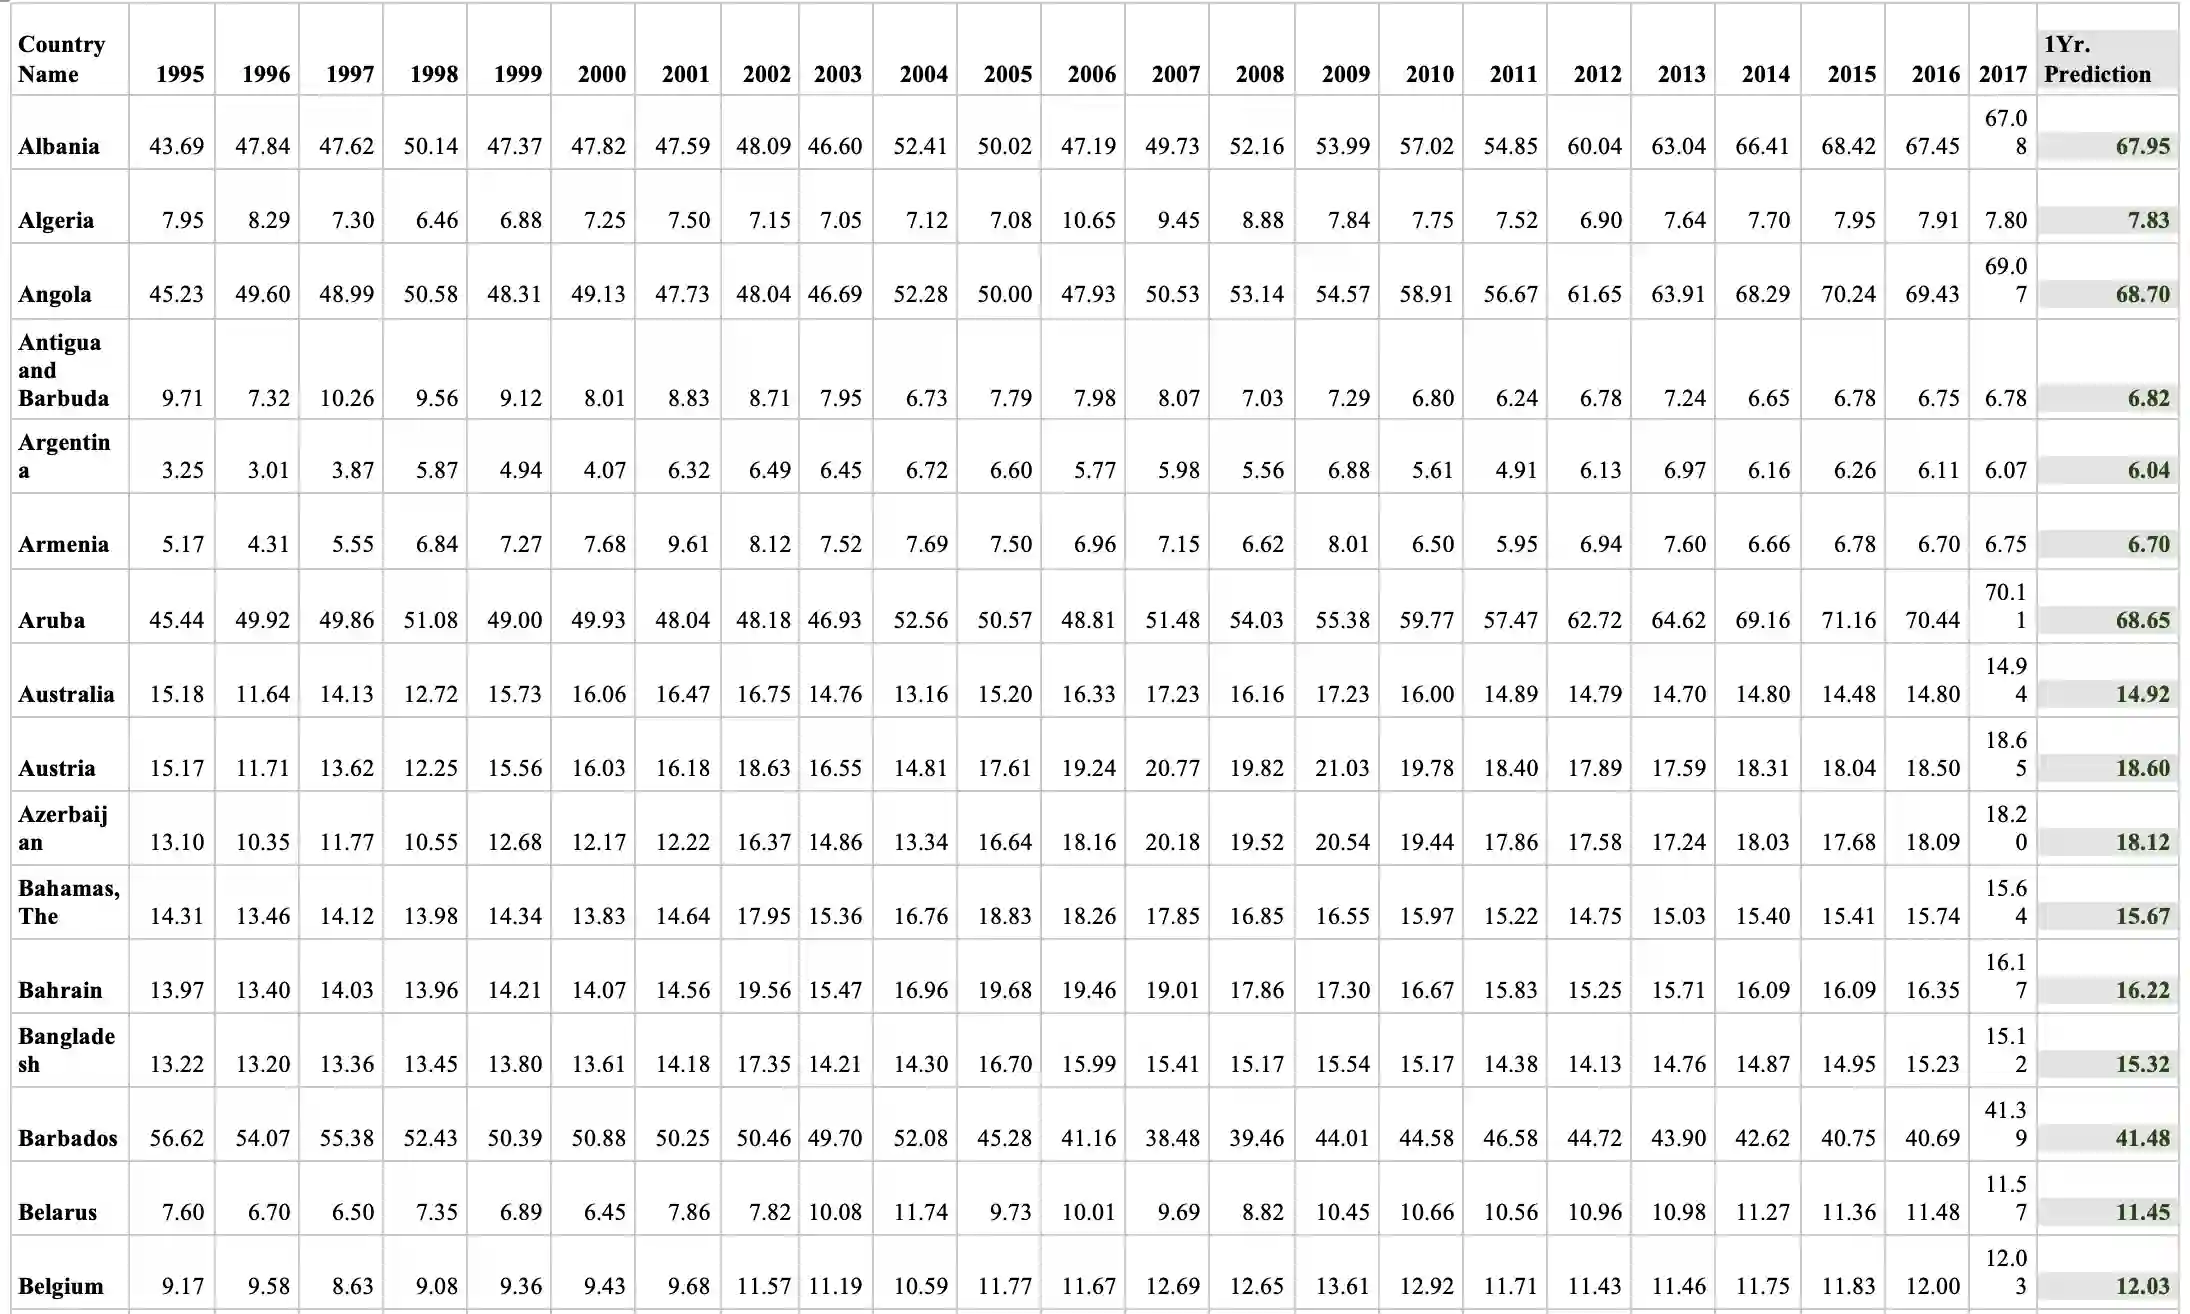
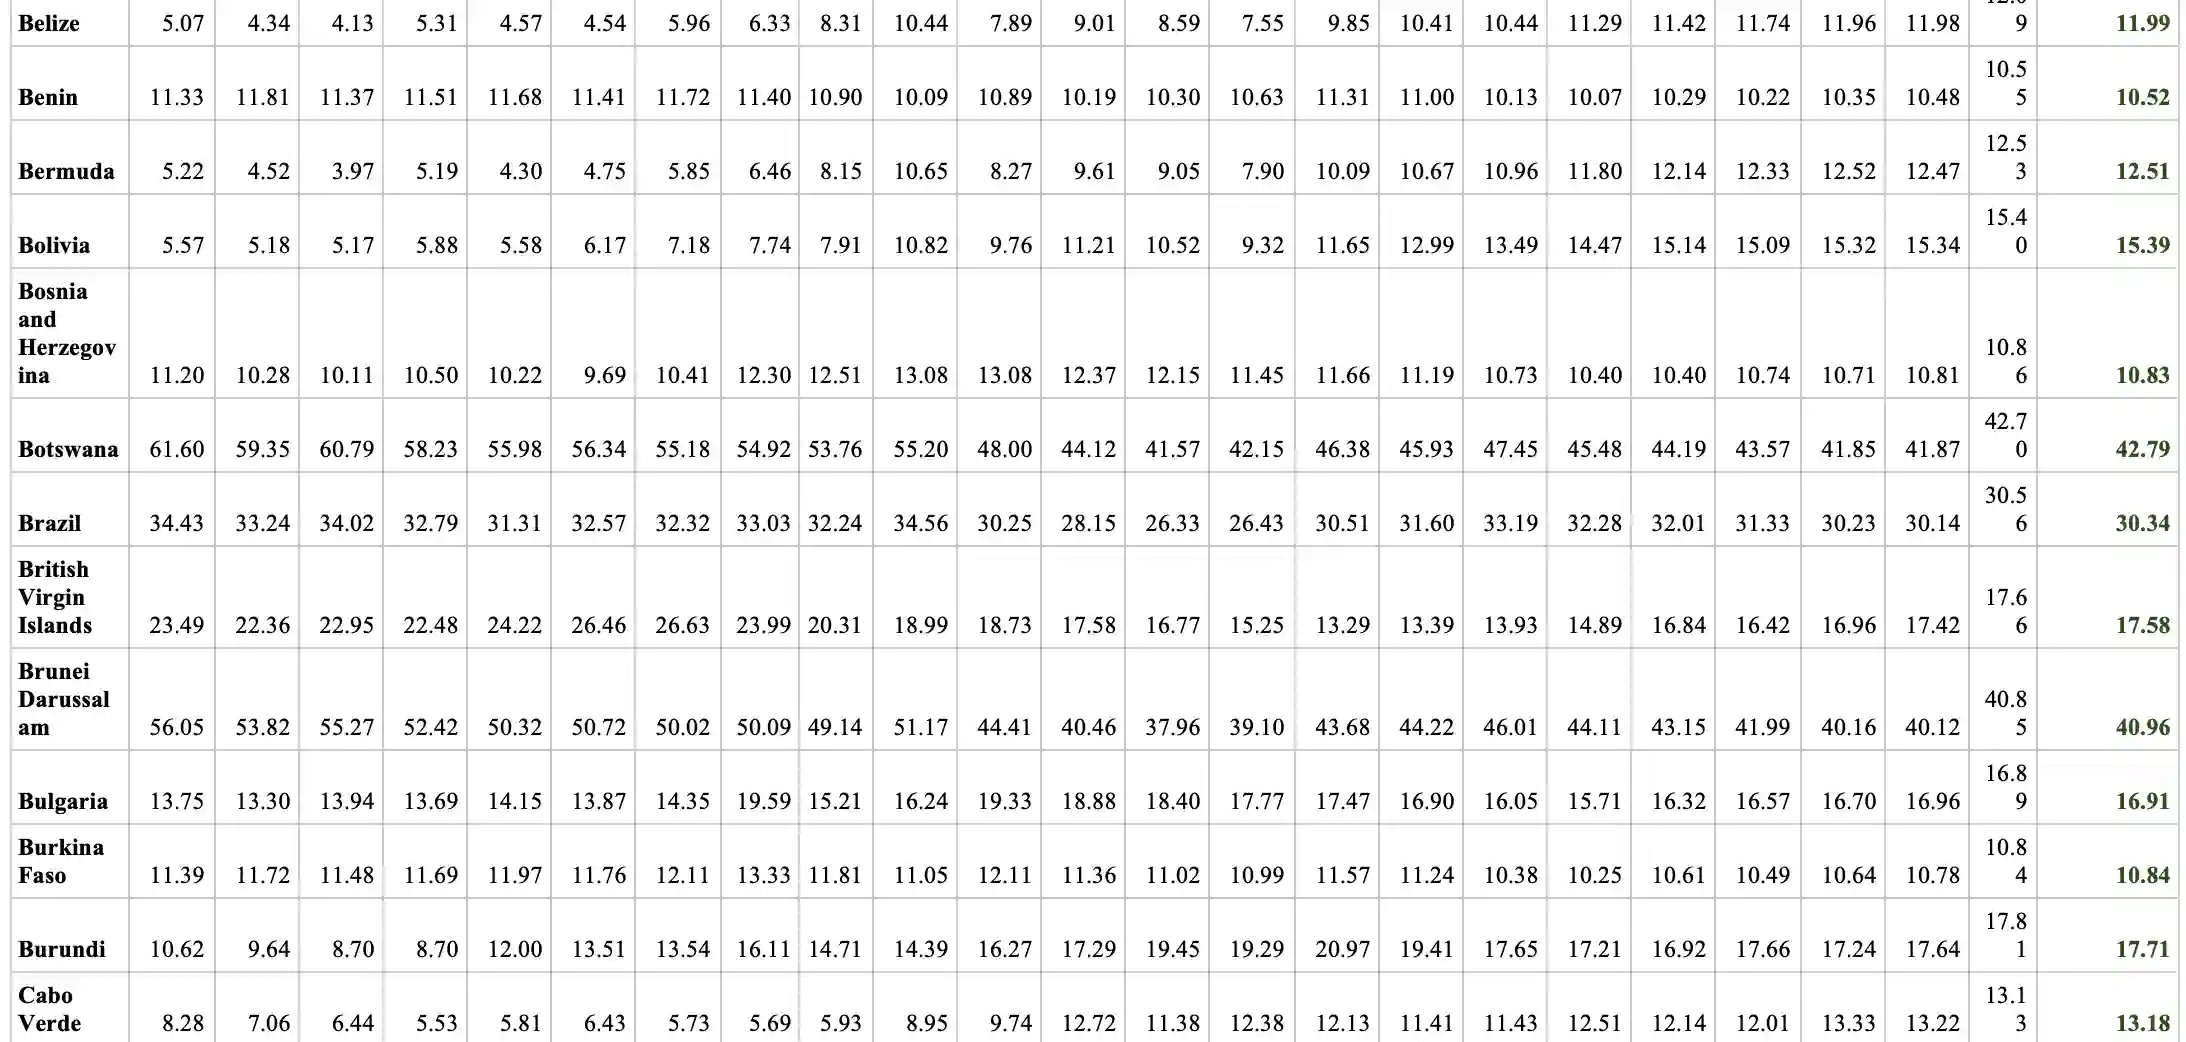
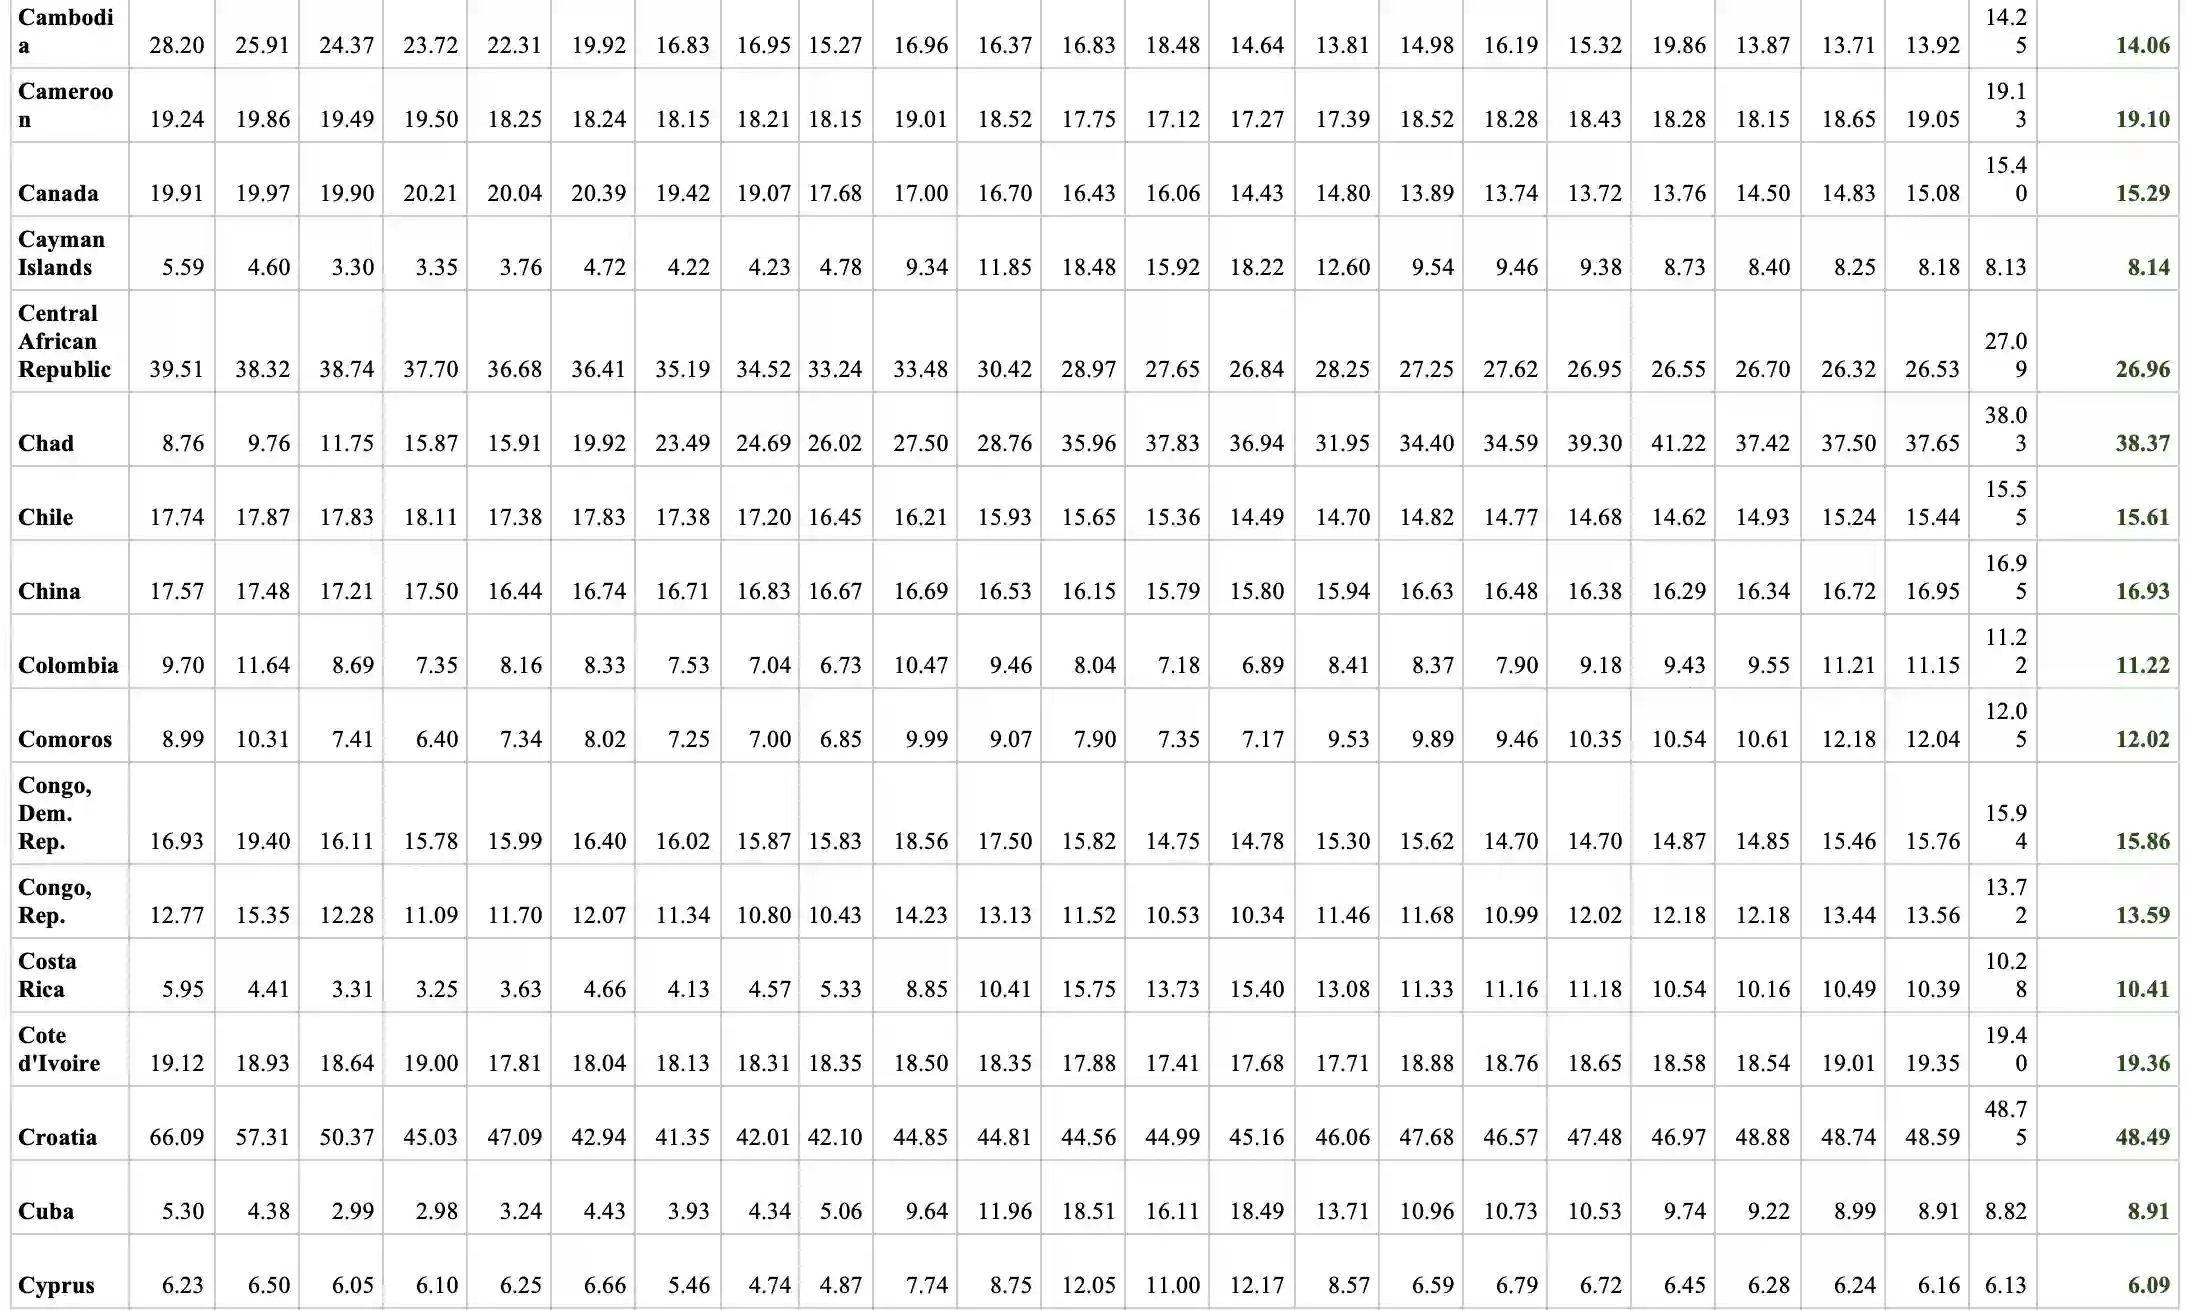
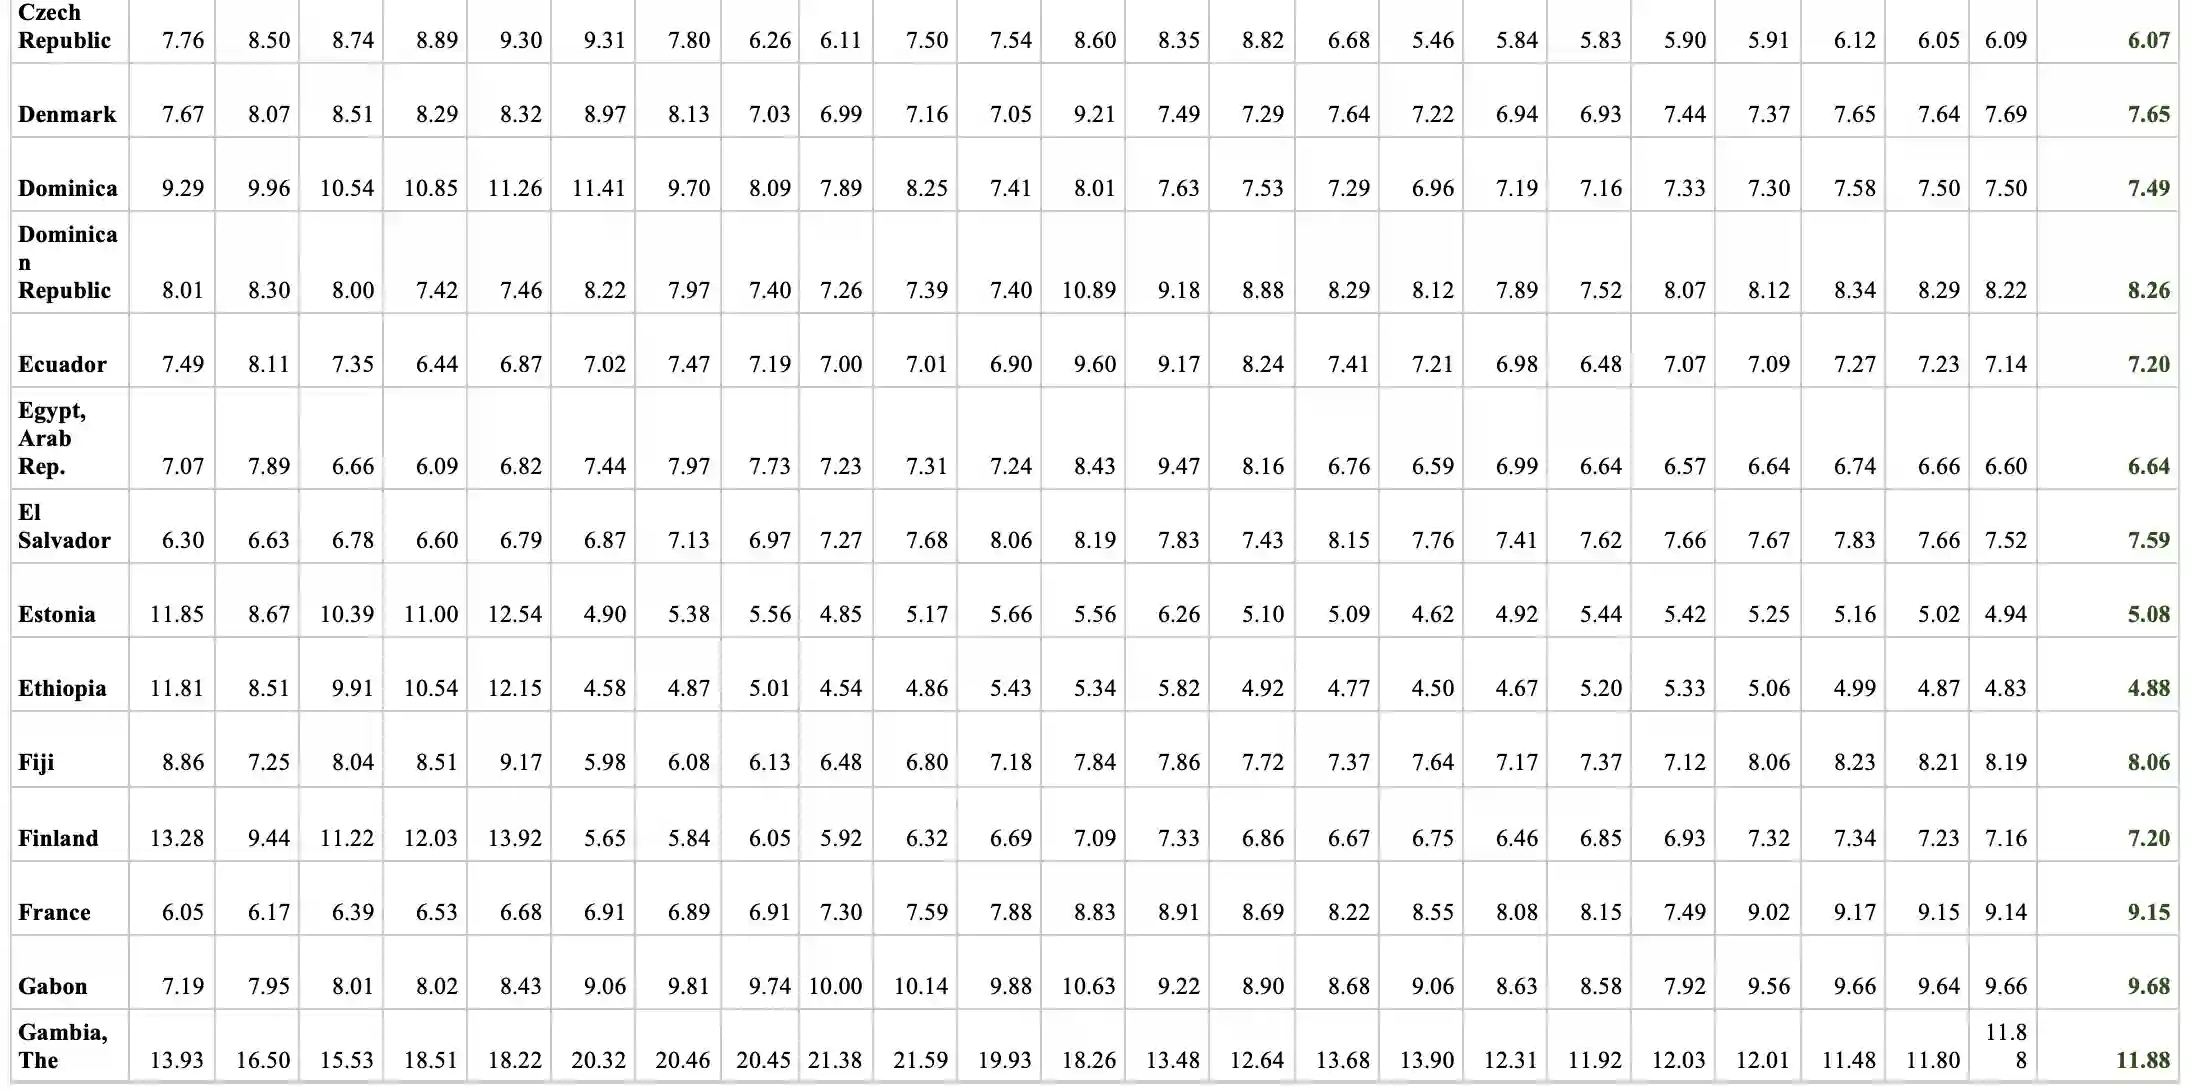
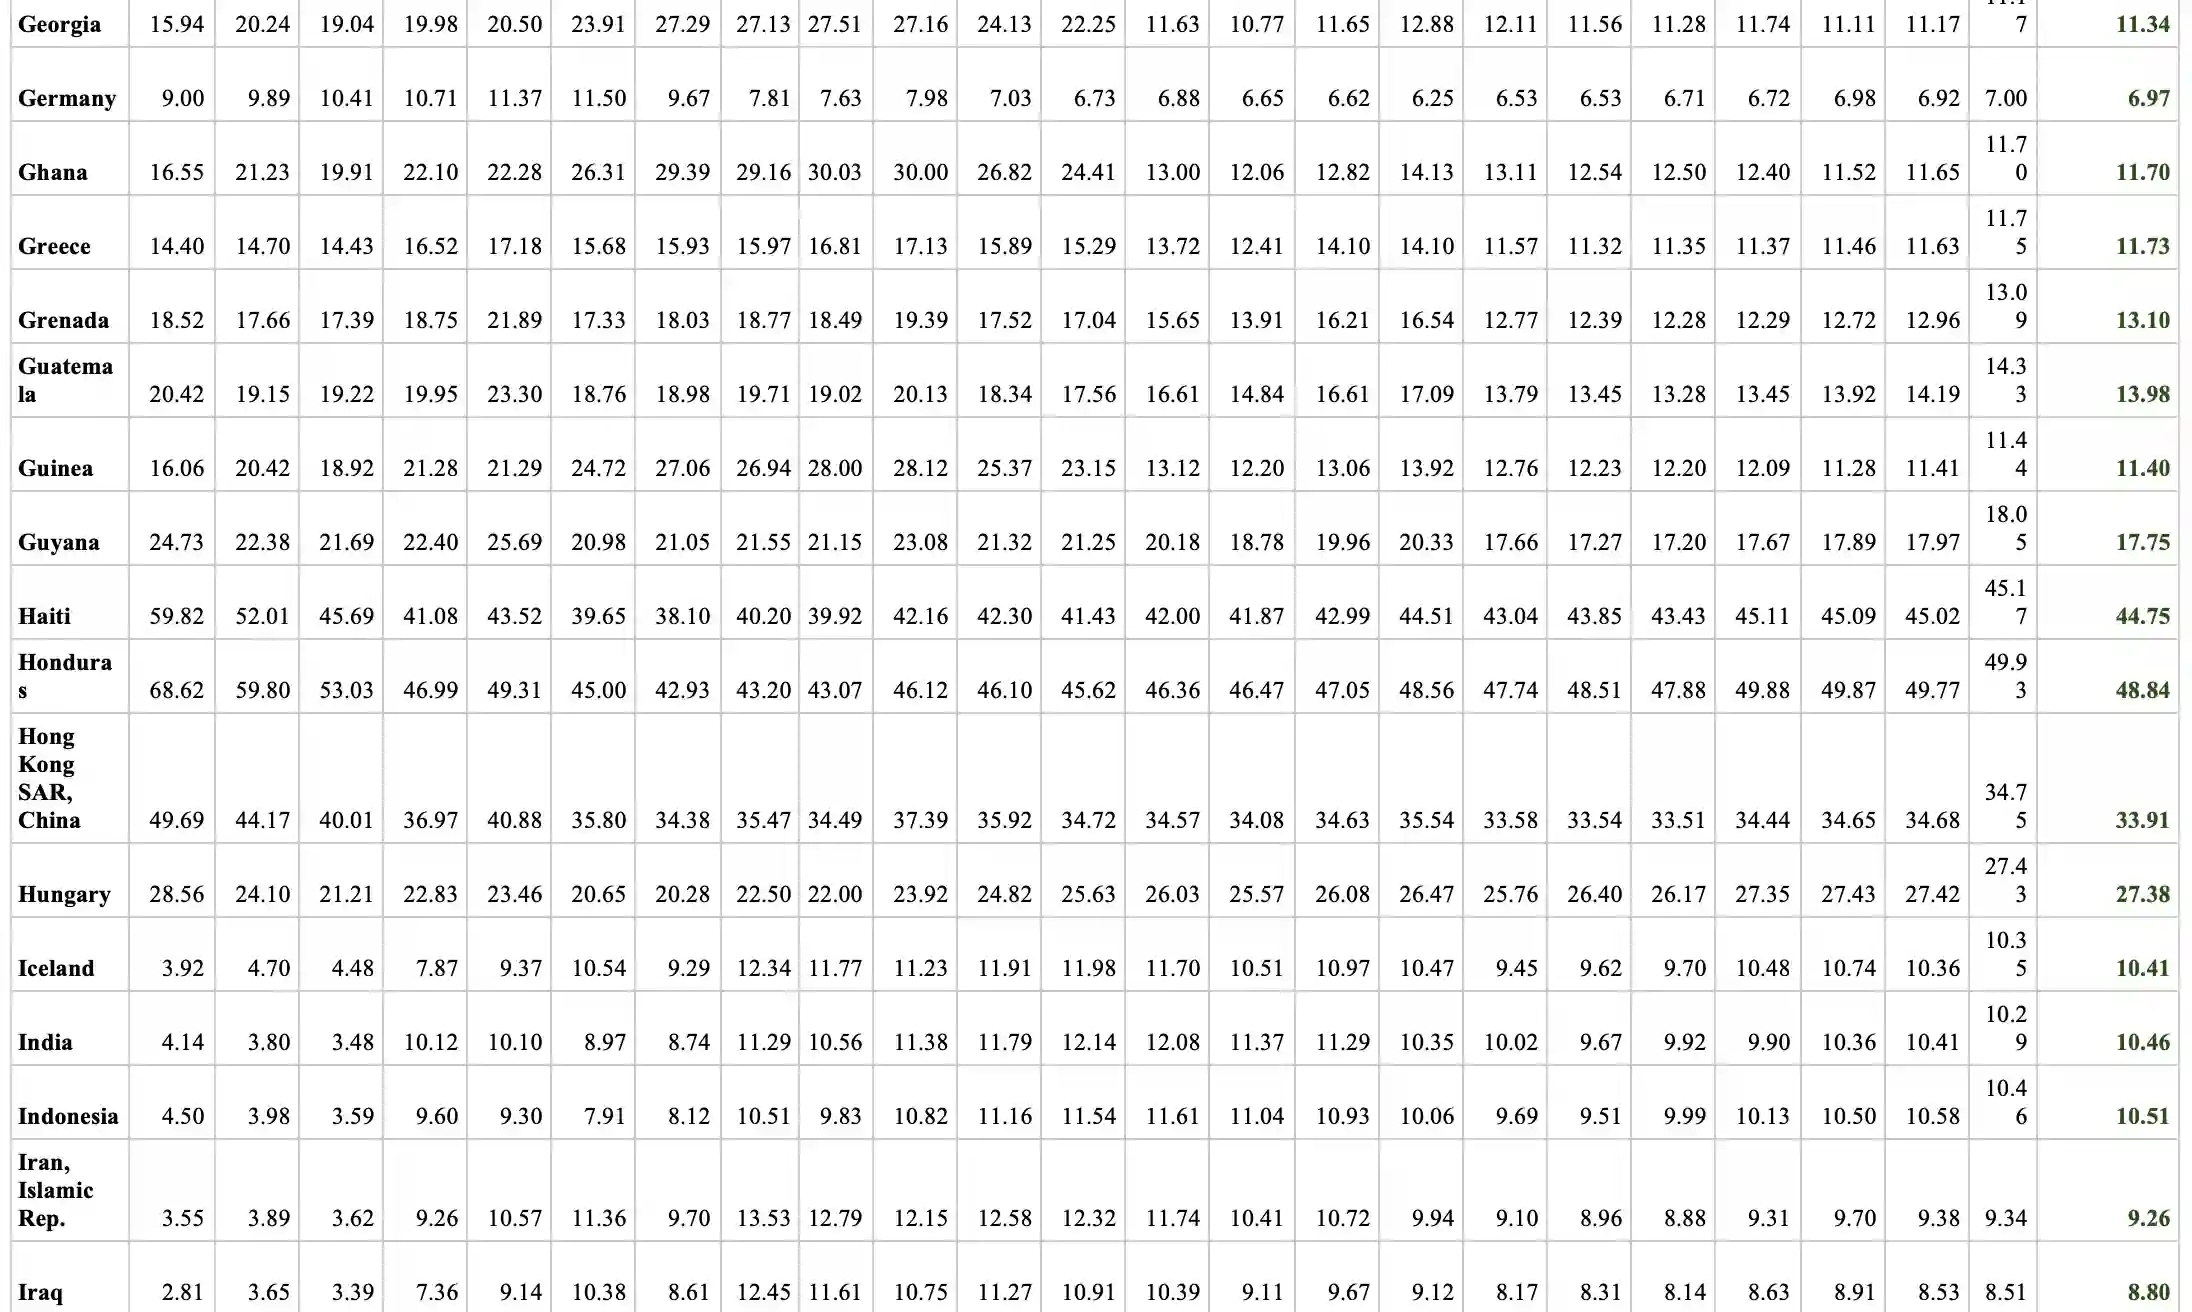
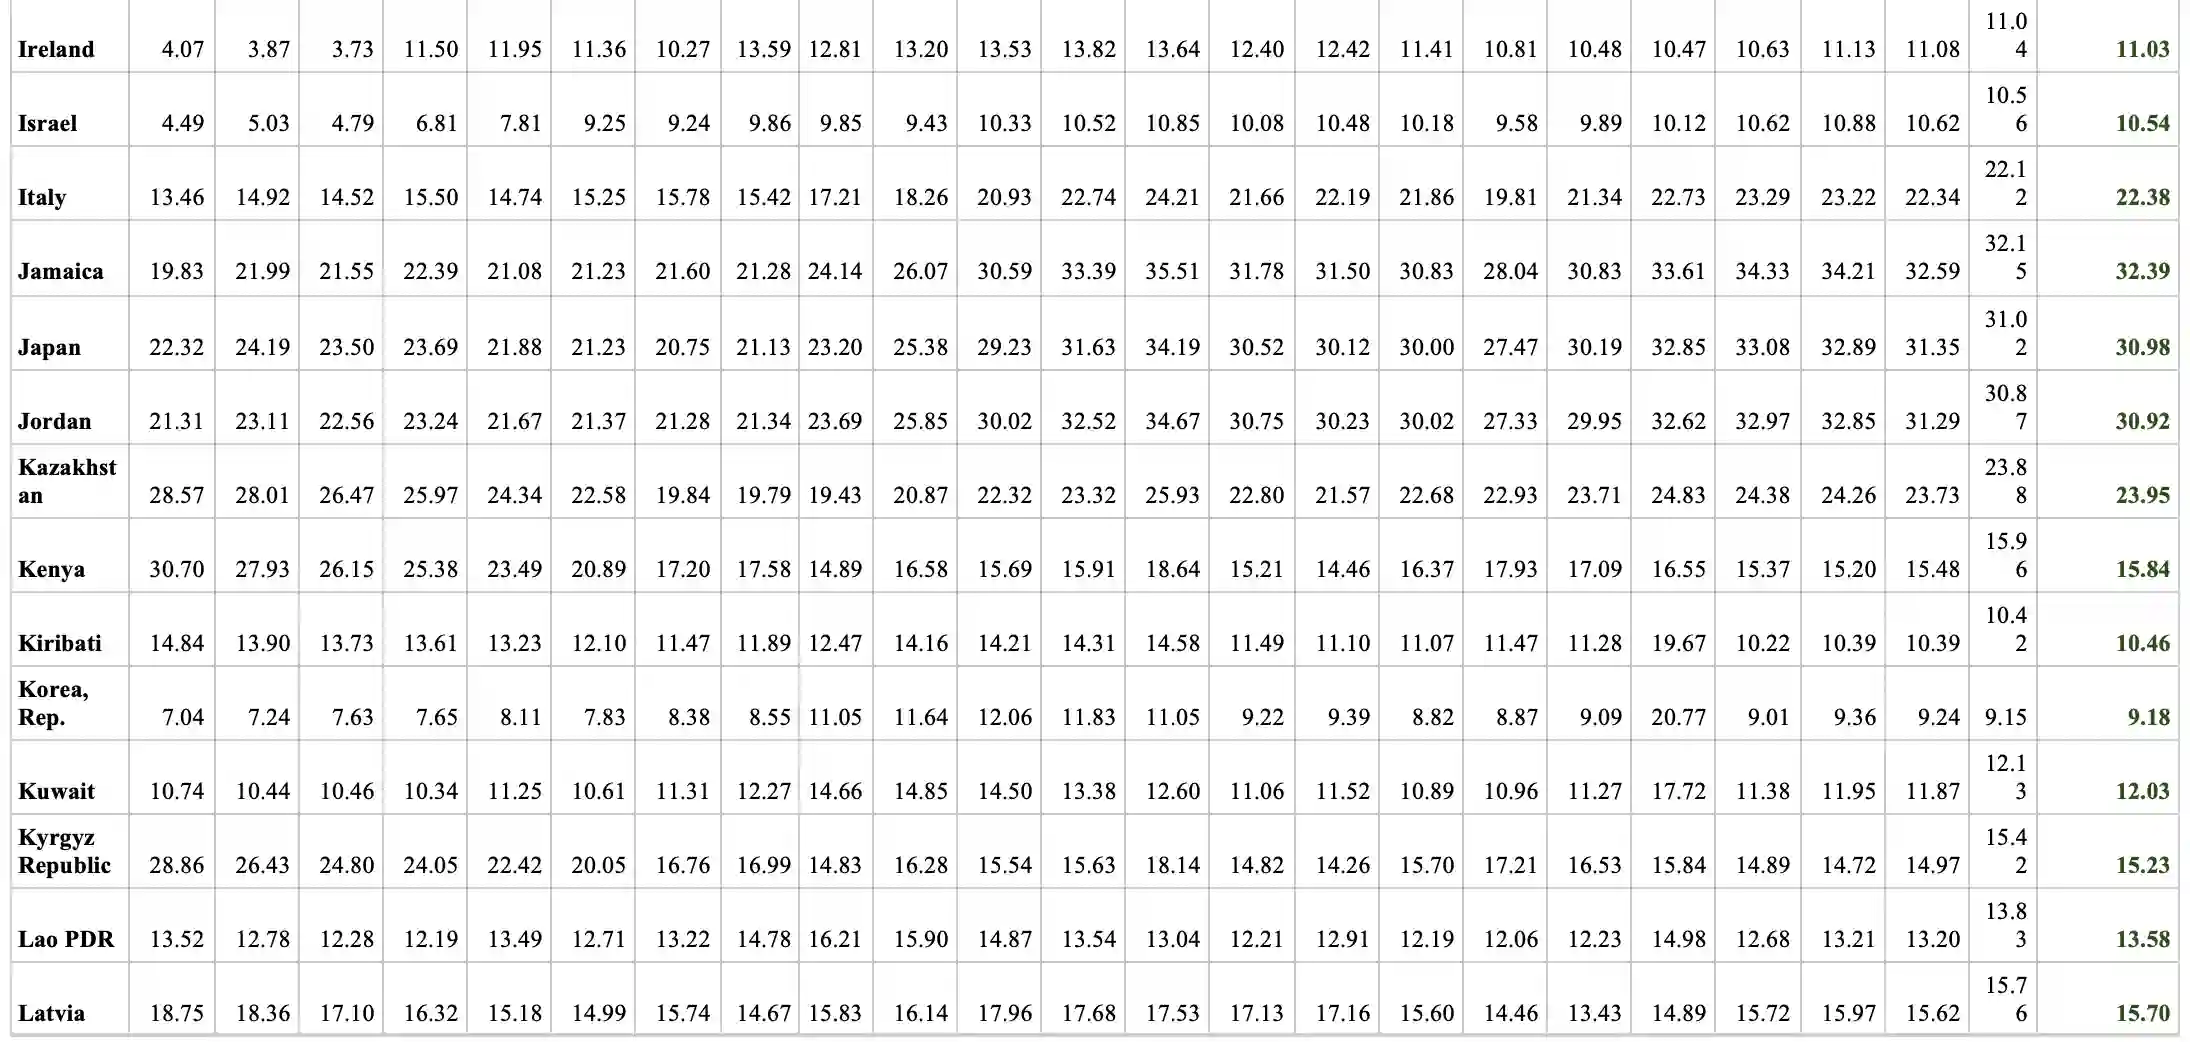
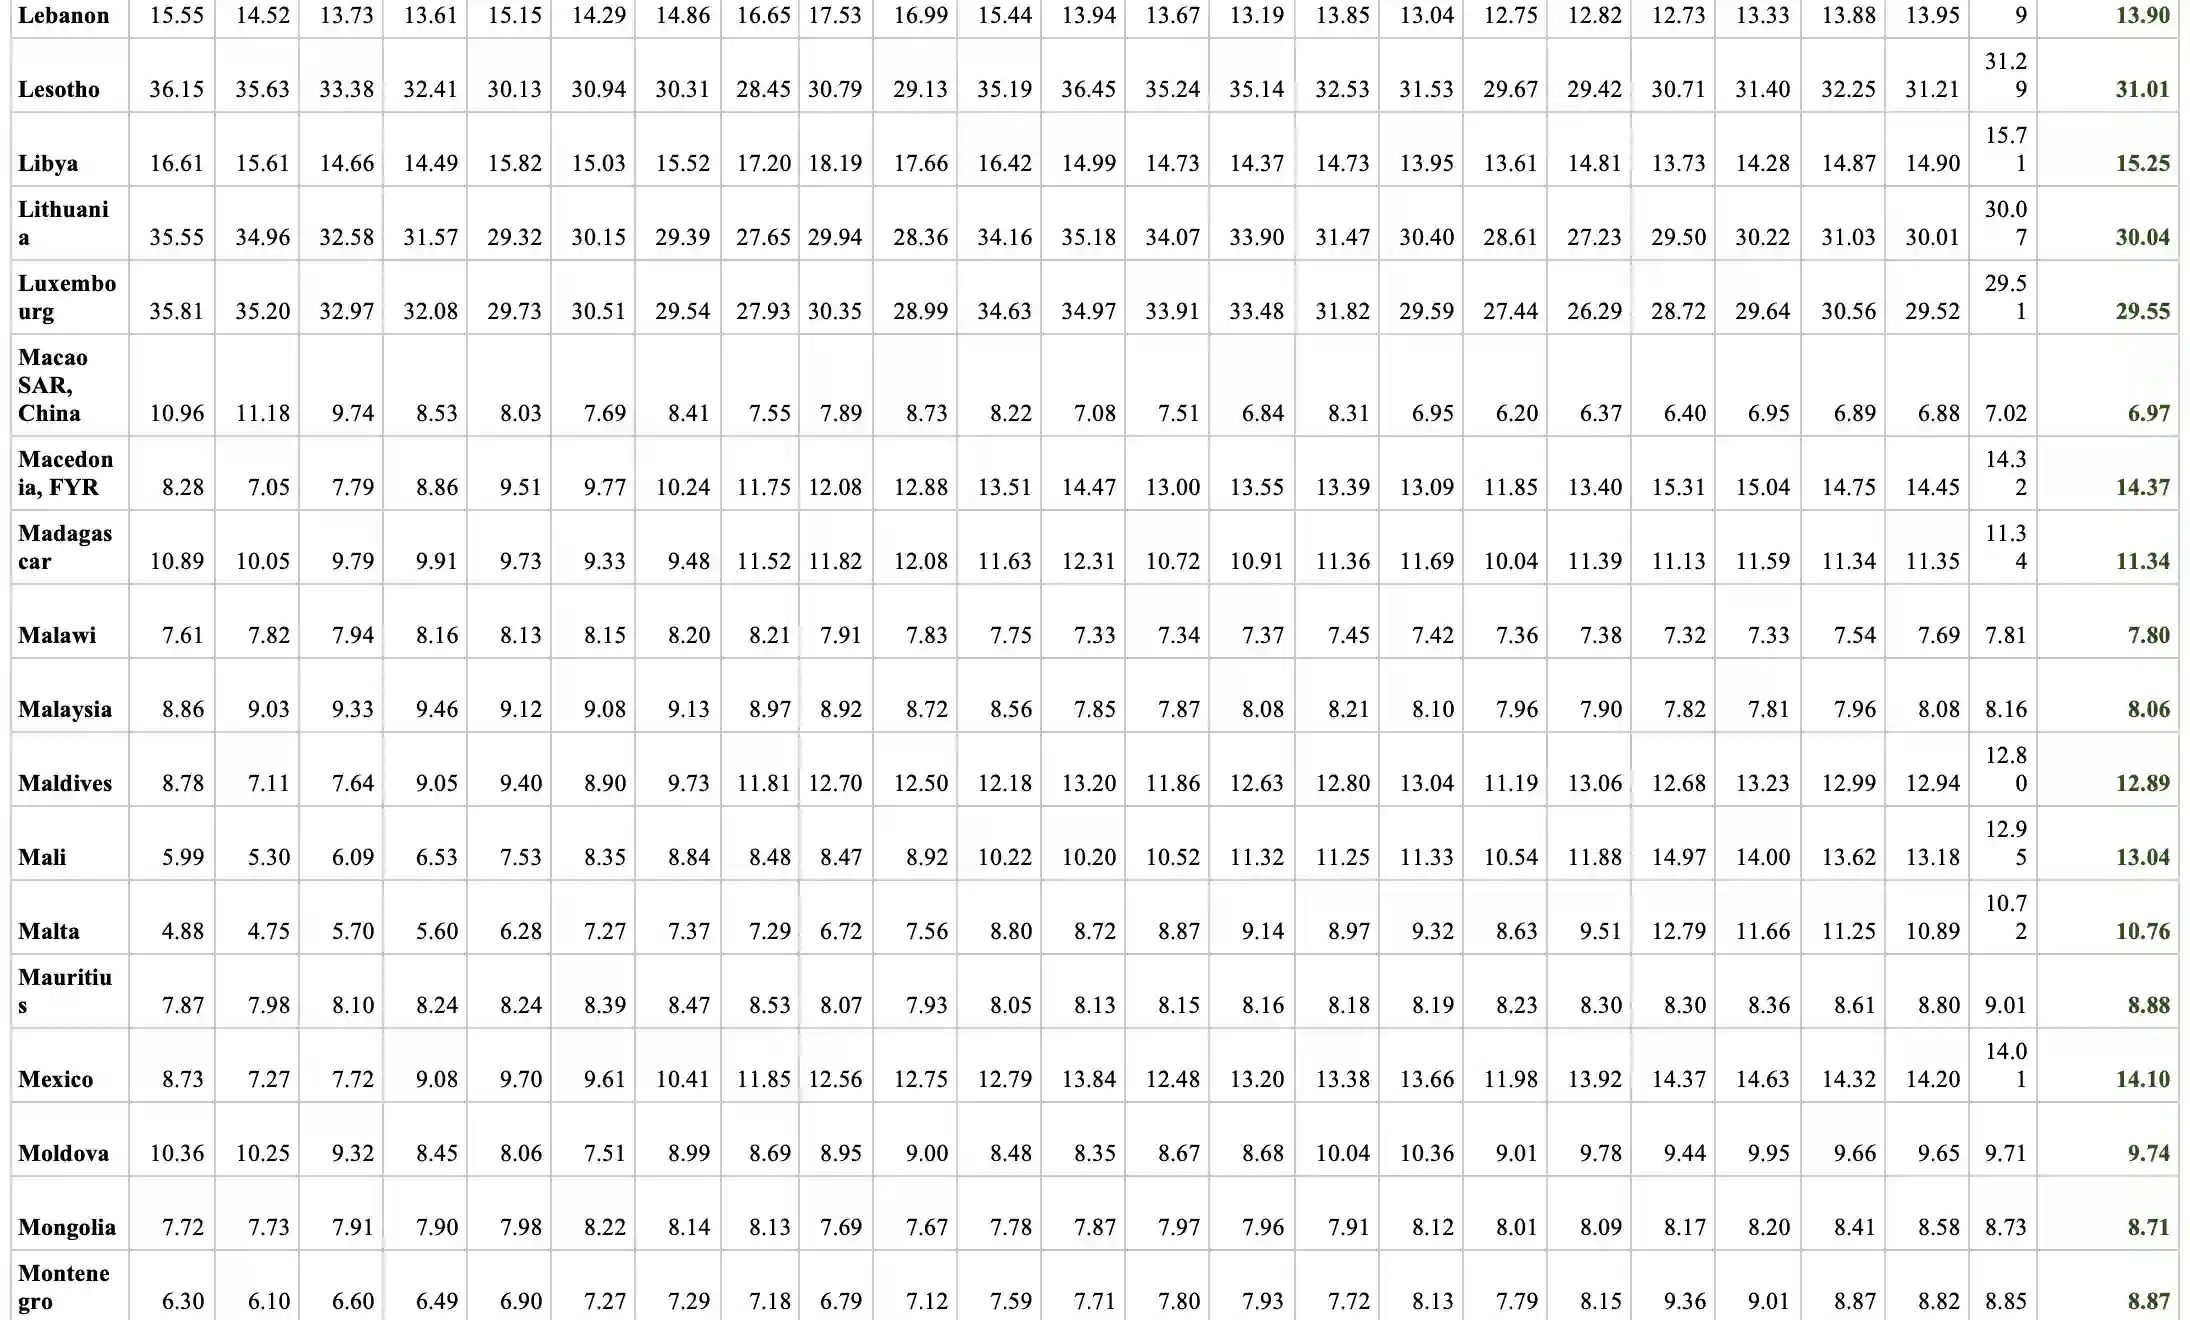
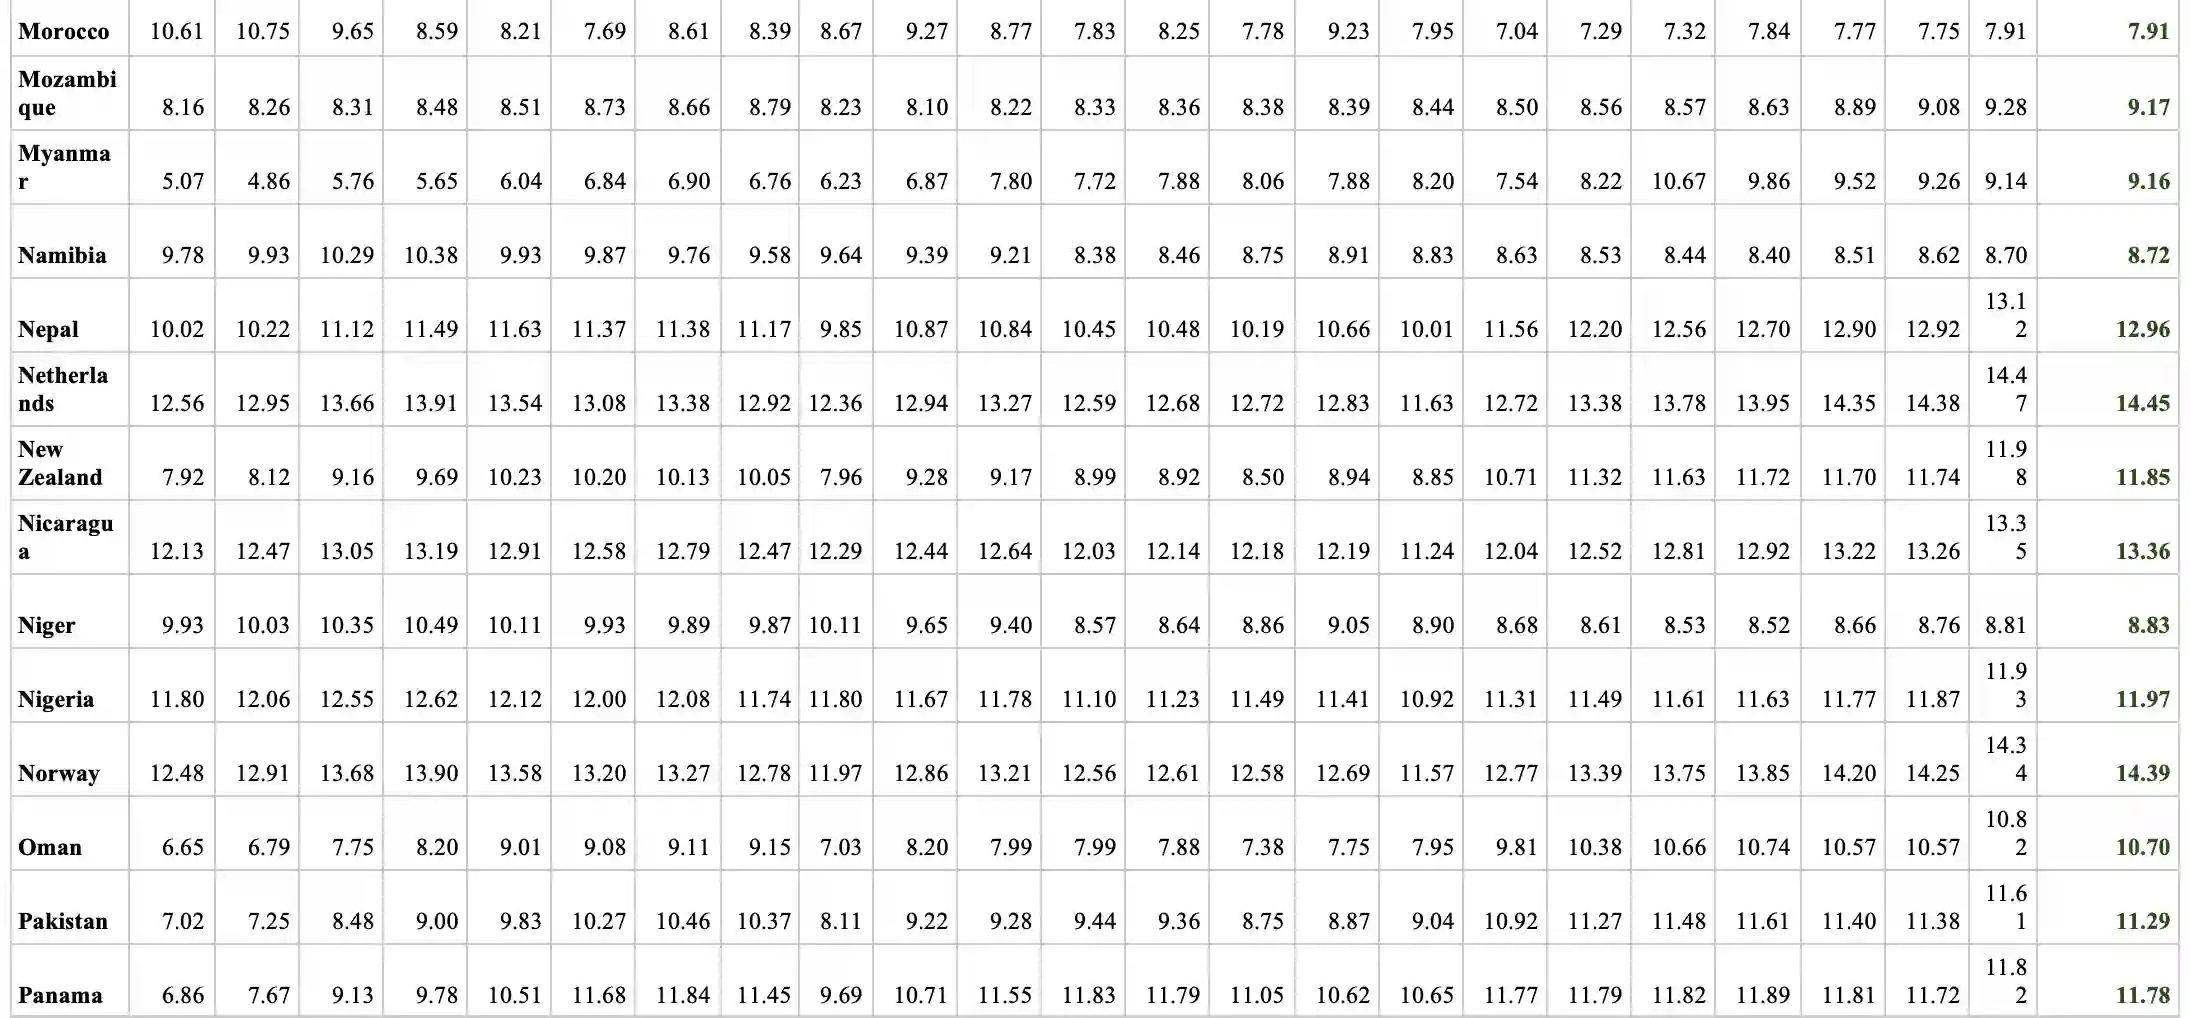
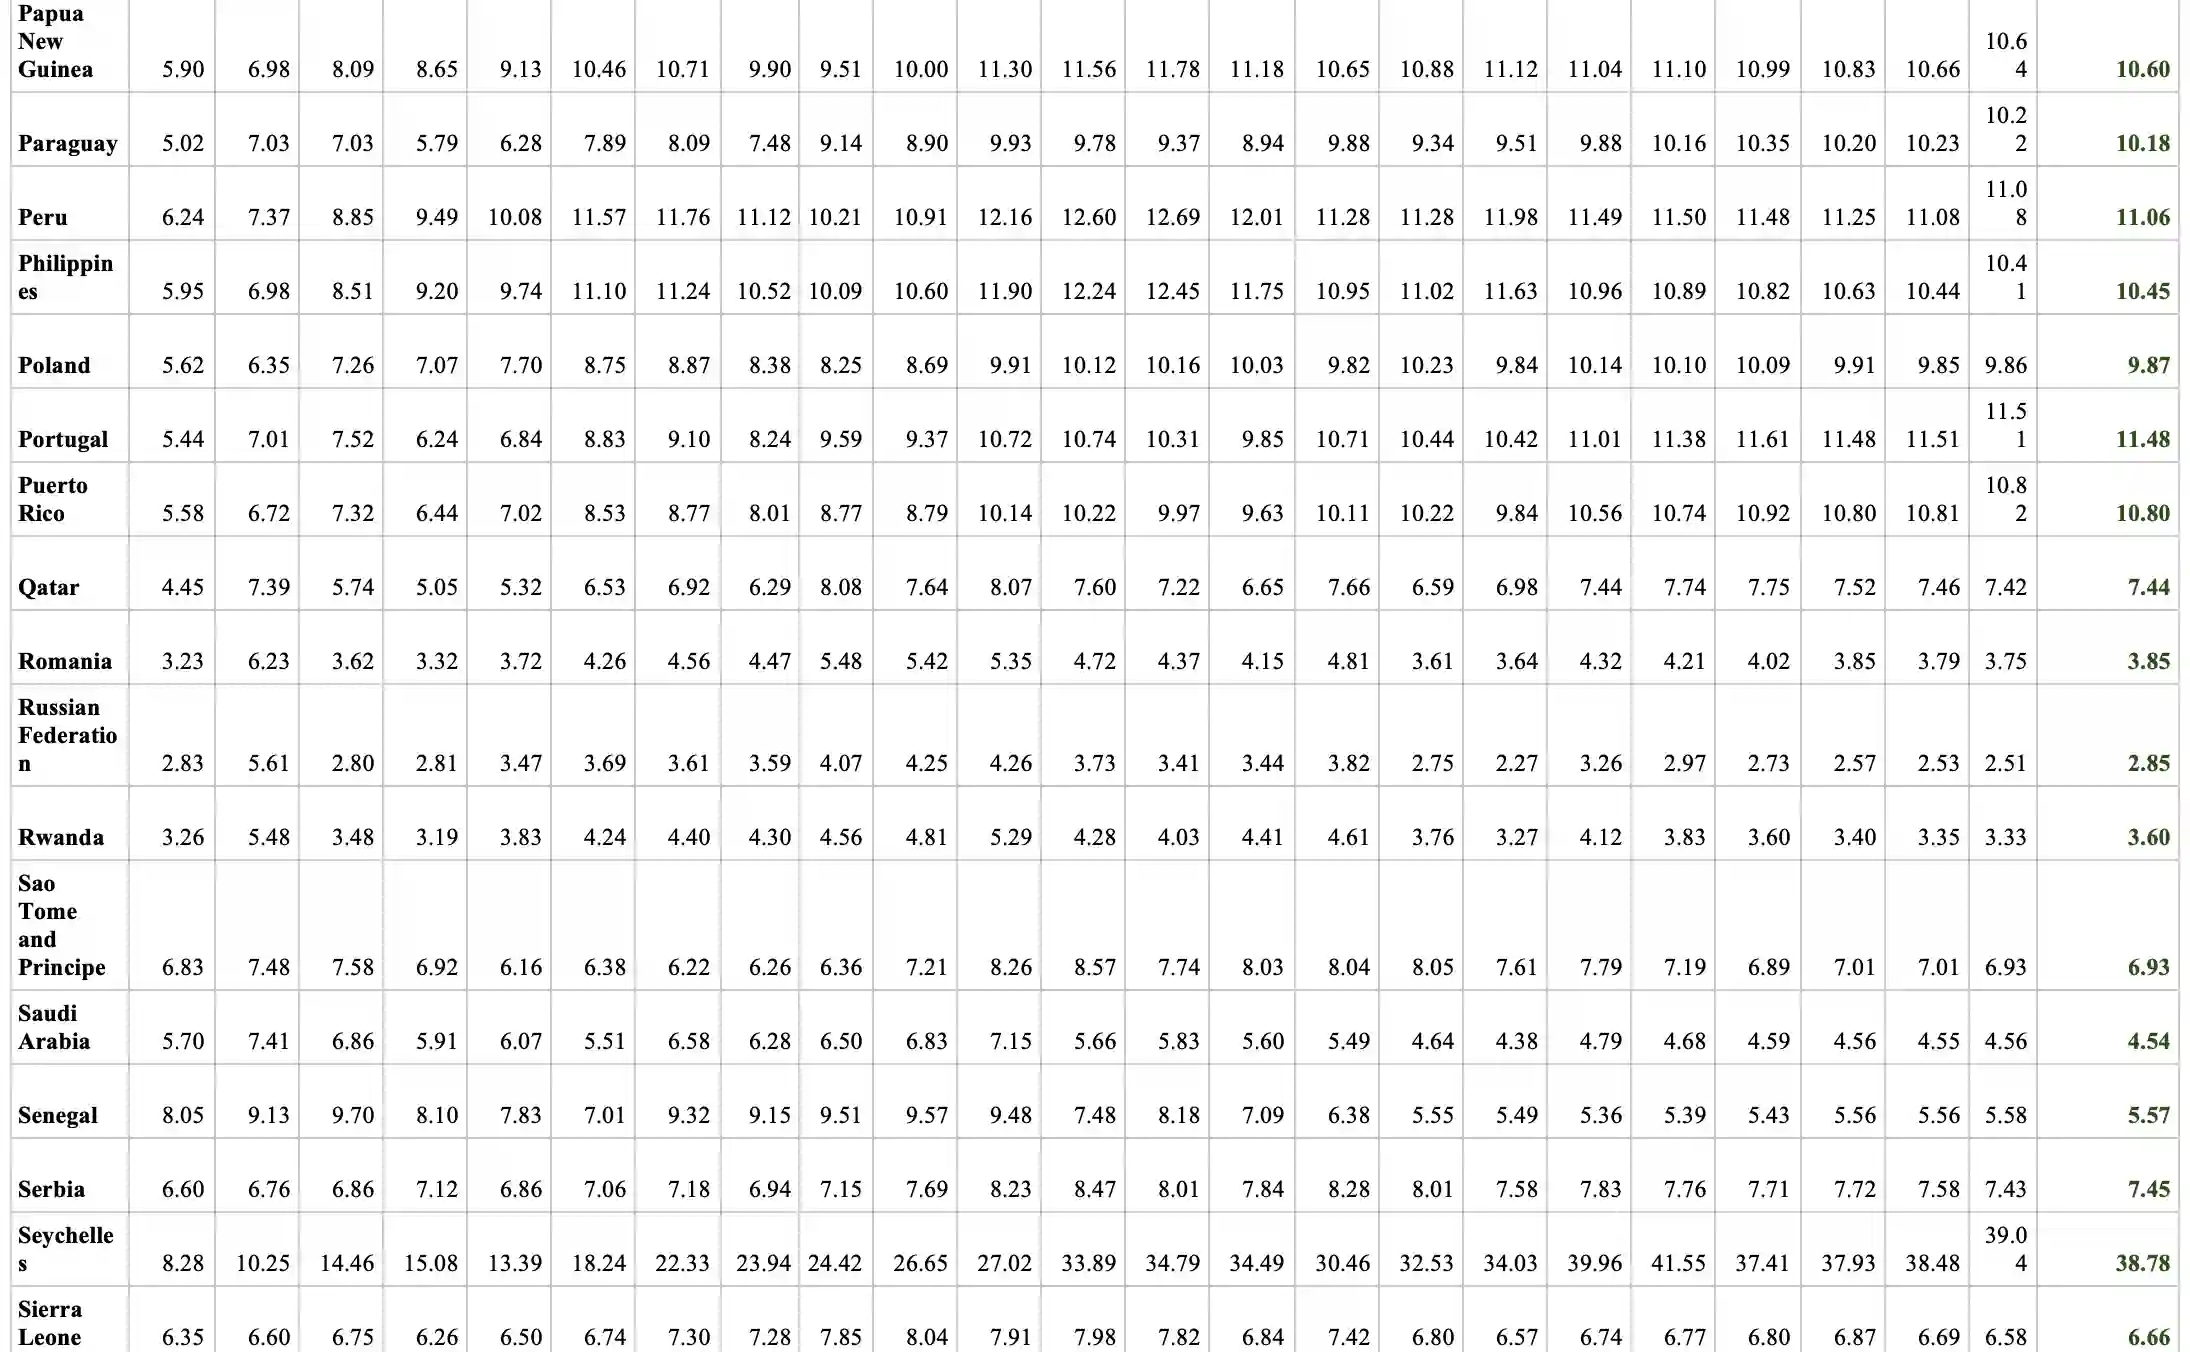
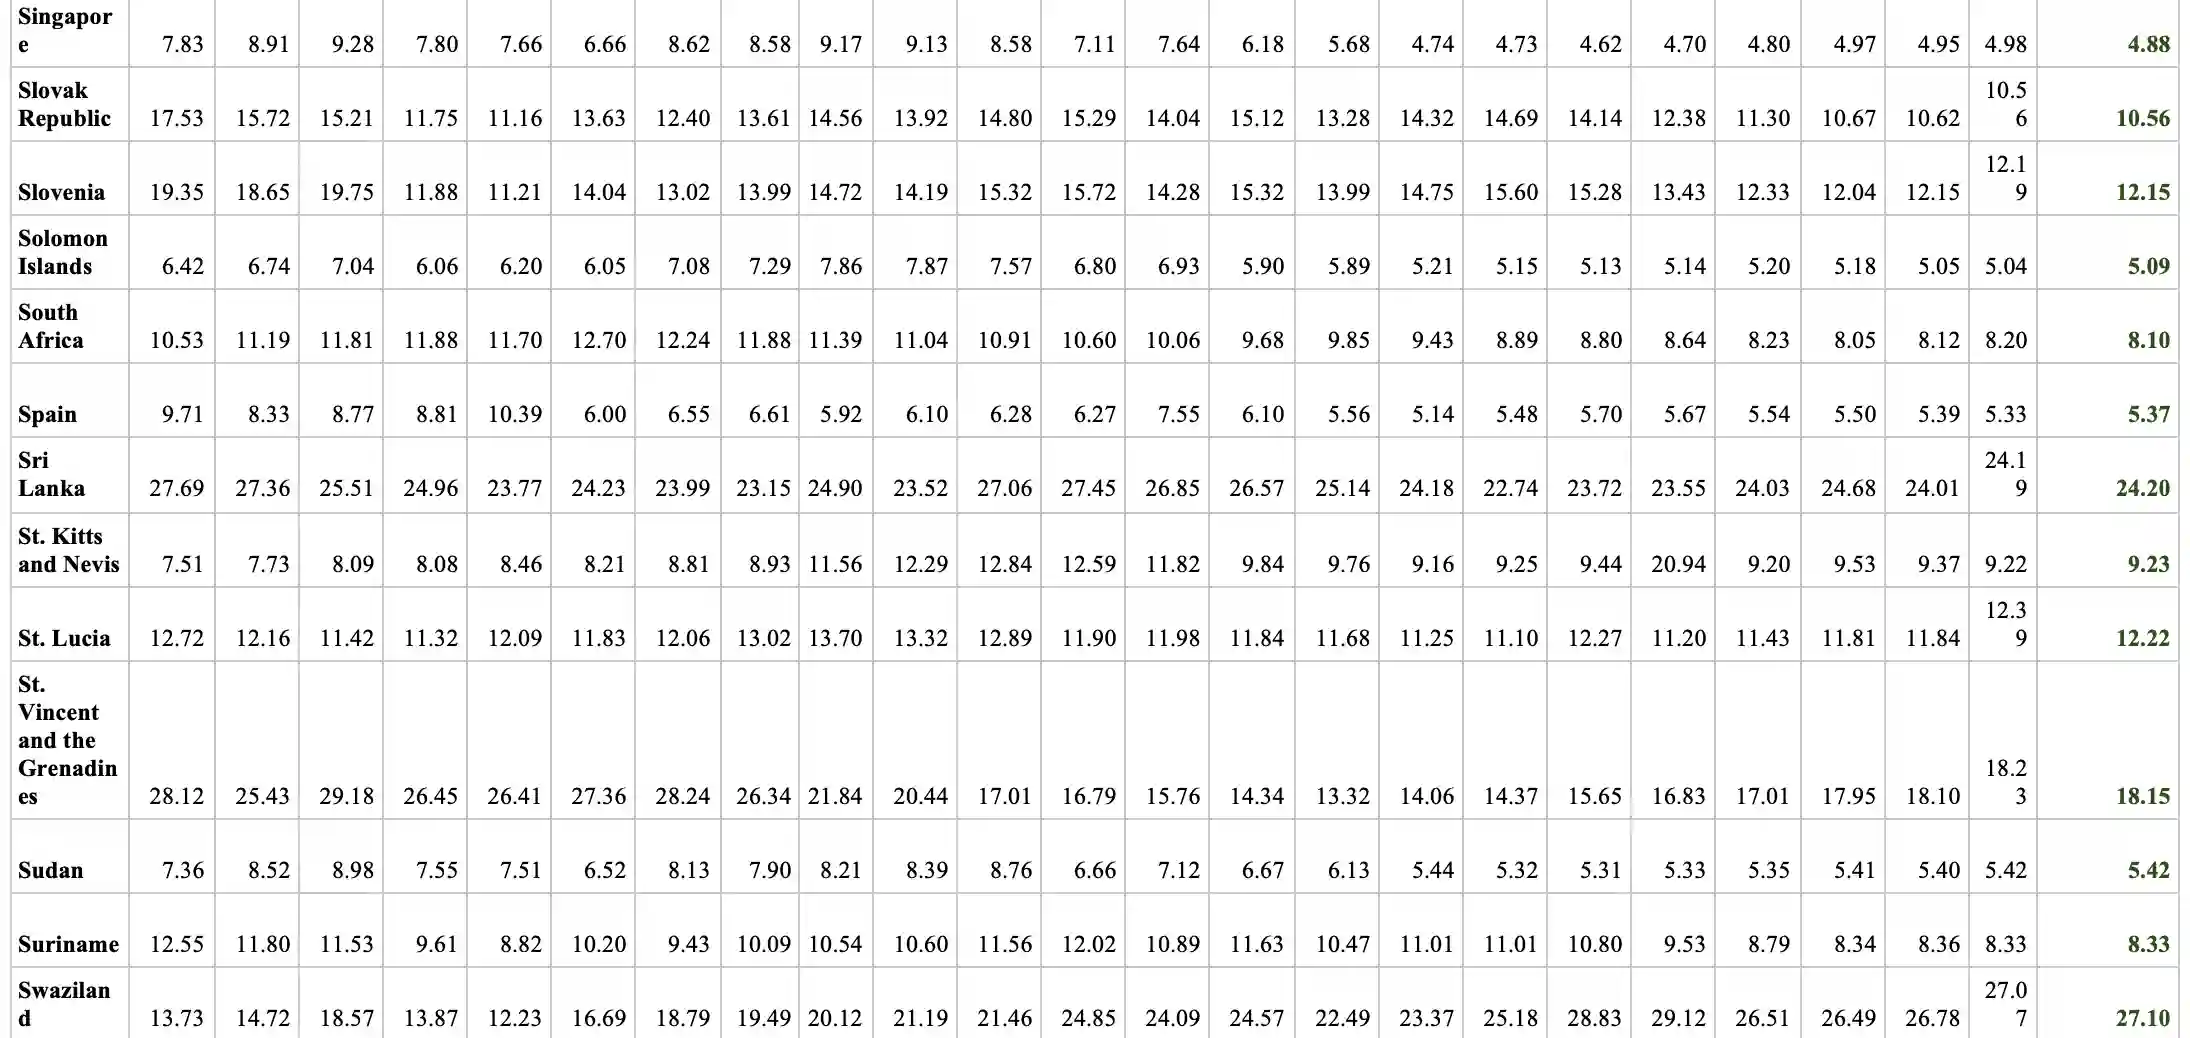
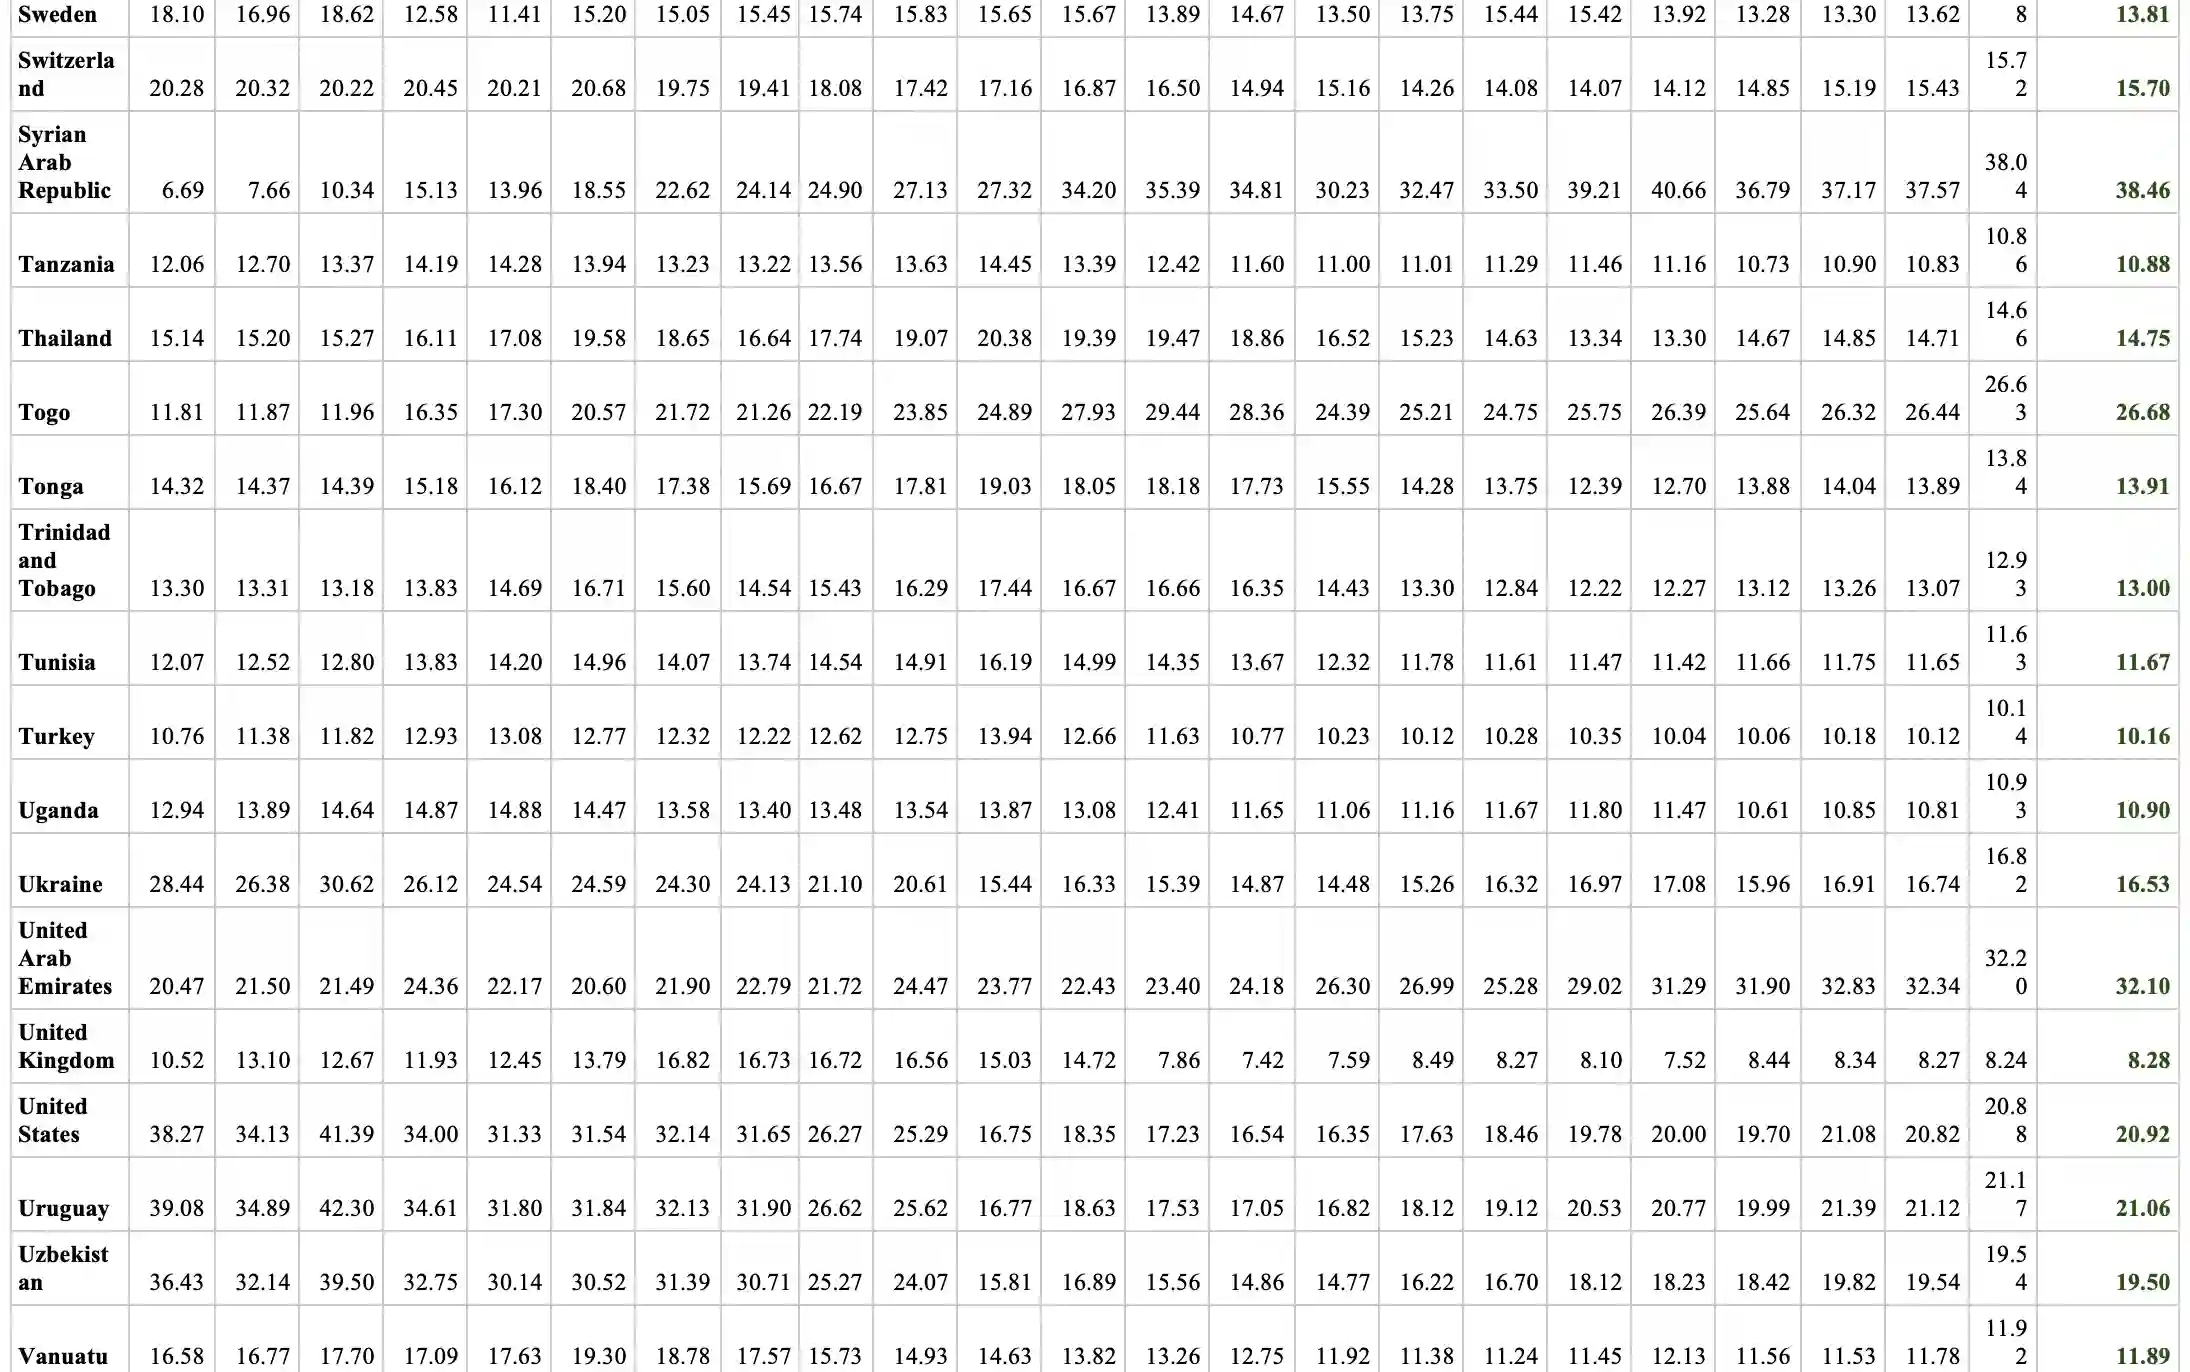
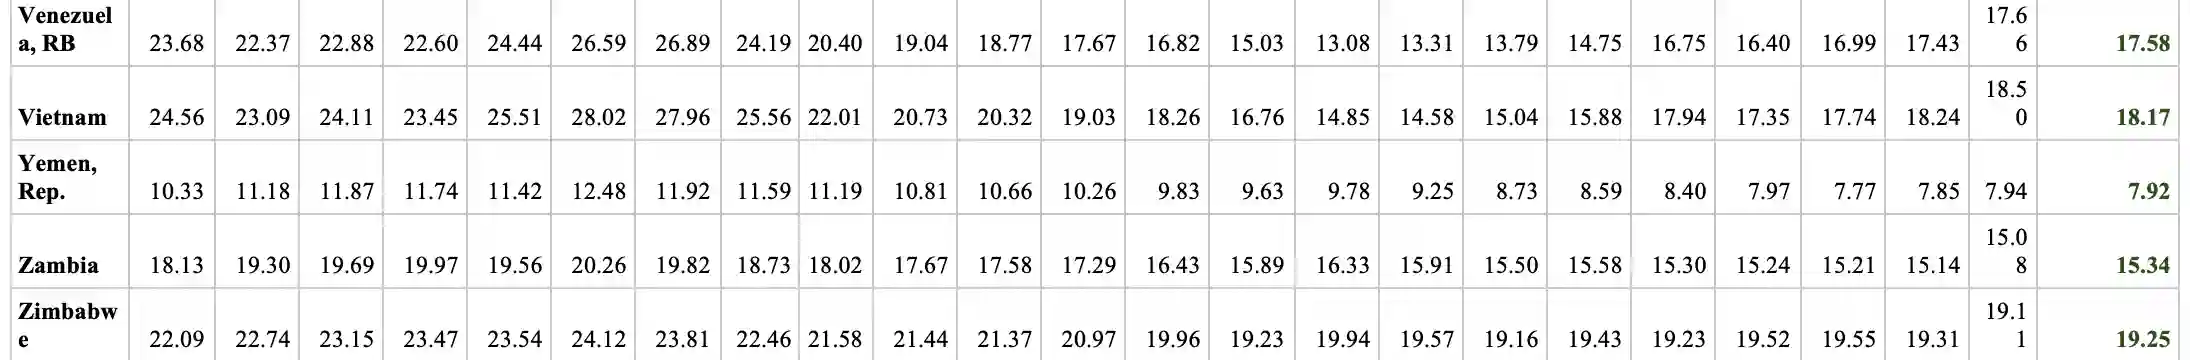
ML supervision was performed using the World Bank 22 years of historical GDP data feeding in to the aft mentioned logistic regression ML modeling. A one-year model prediction was successfully produced as detailed in Appendix A for all 176 countries under consideration. For illustration purposes a sample of four countries (Aruba, Barbados, Jamaica and the United States) has been visualized using a histogram in Figure 2.
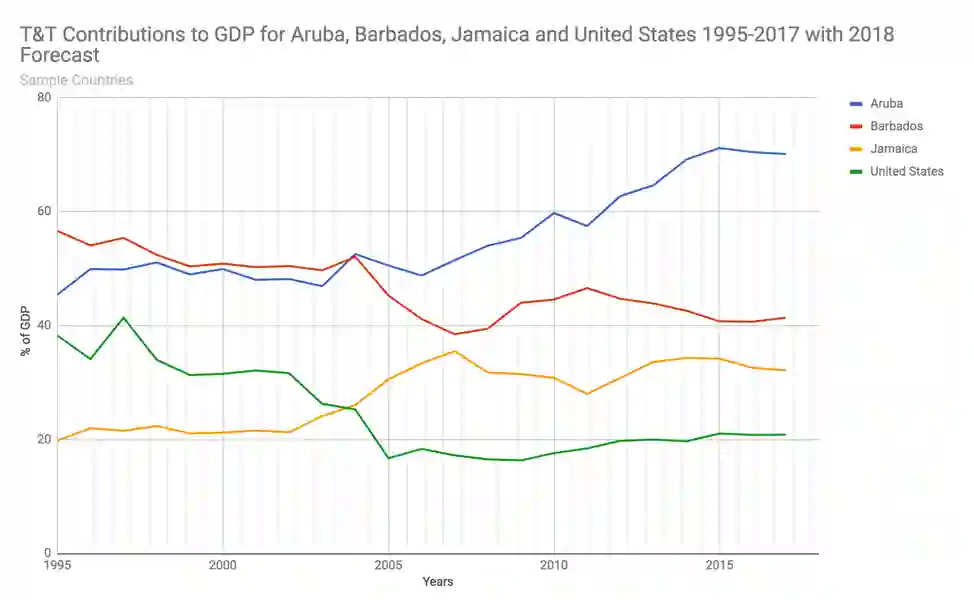
Figure 2: T&T Sampled Contributions to GDP for the Period covering 1995-2017, forecasting 2018
By way of comparison the data forecast for 2018 is roughly in line with historical relationships to GDP for all countries observed. The strength of the logistic regression ML model can be seen with no significant outliers in the predicted GDP data across all 176 countries forecasted. This reinforces the ROC model quality.
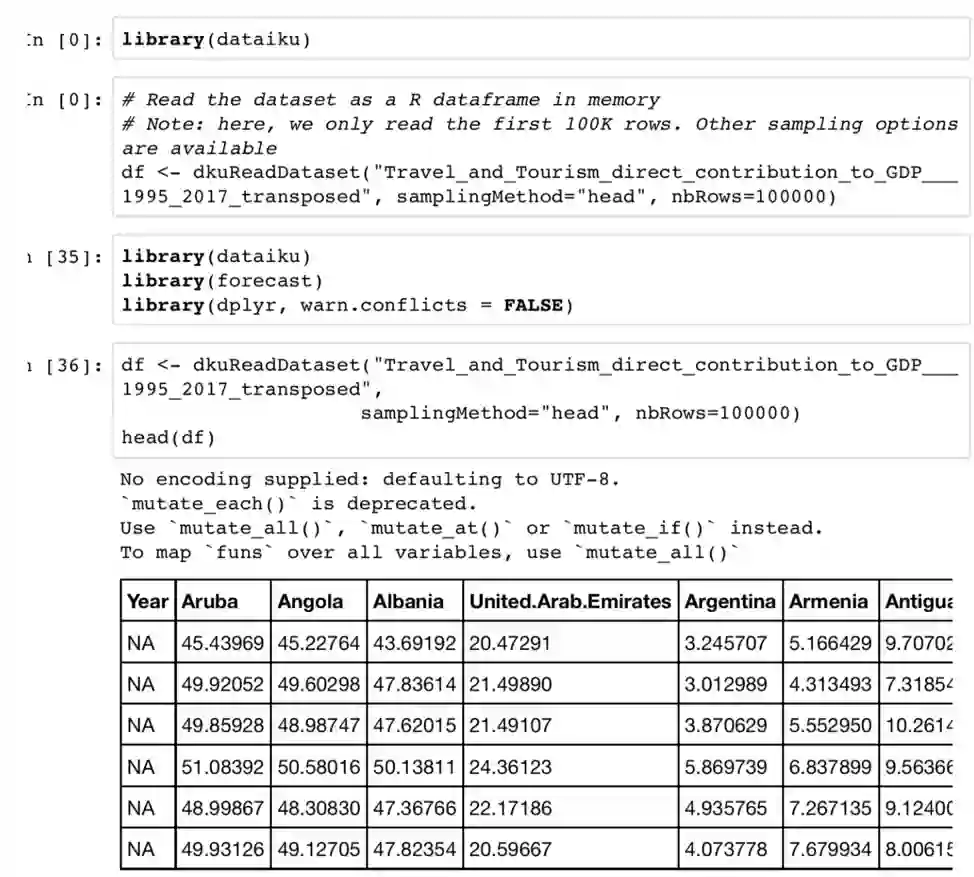
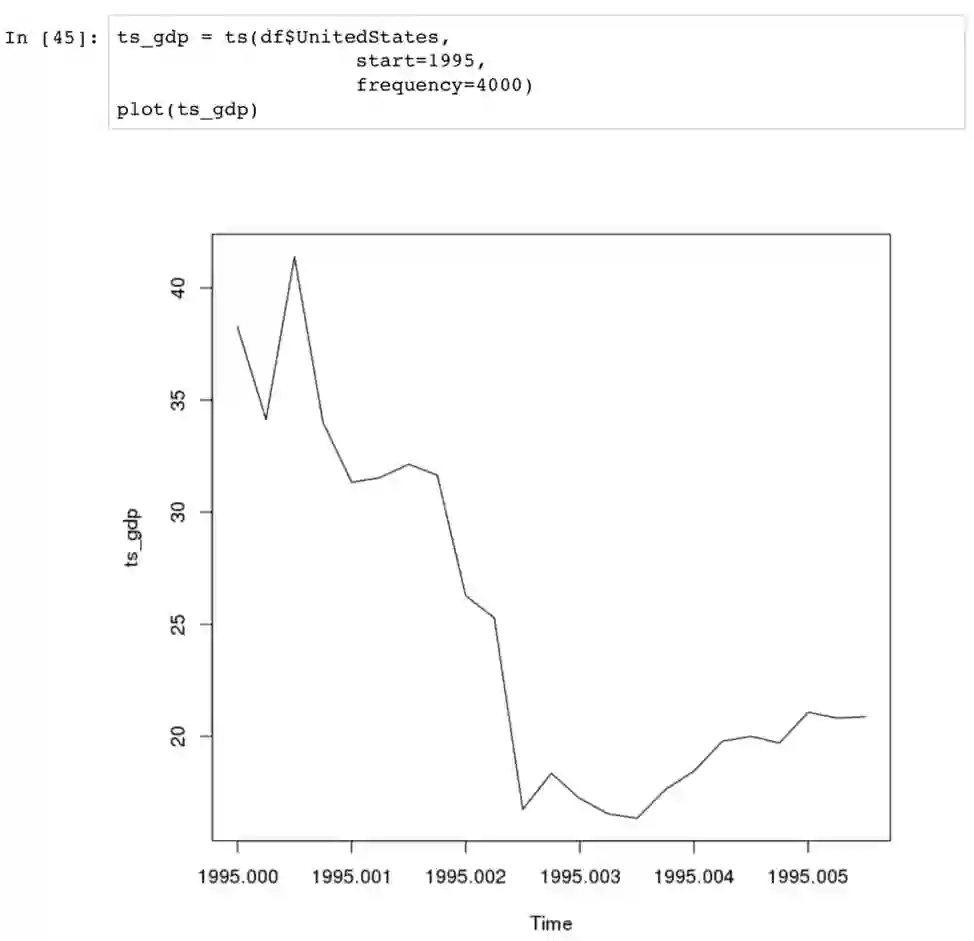
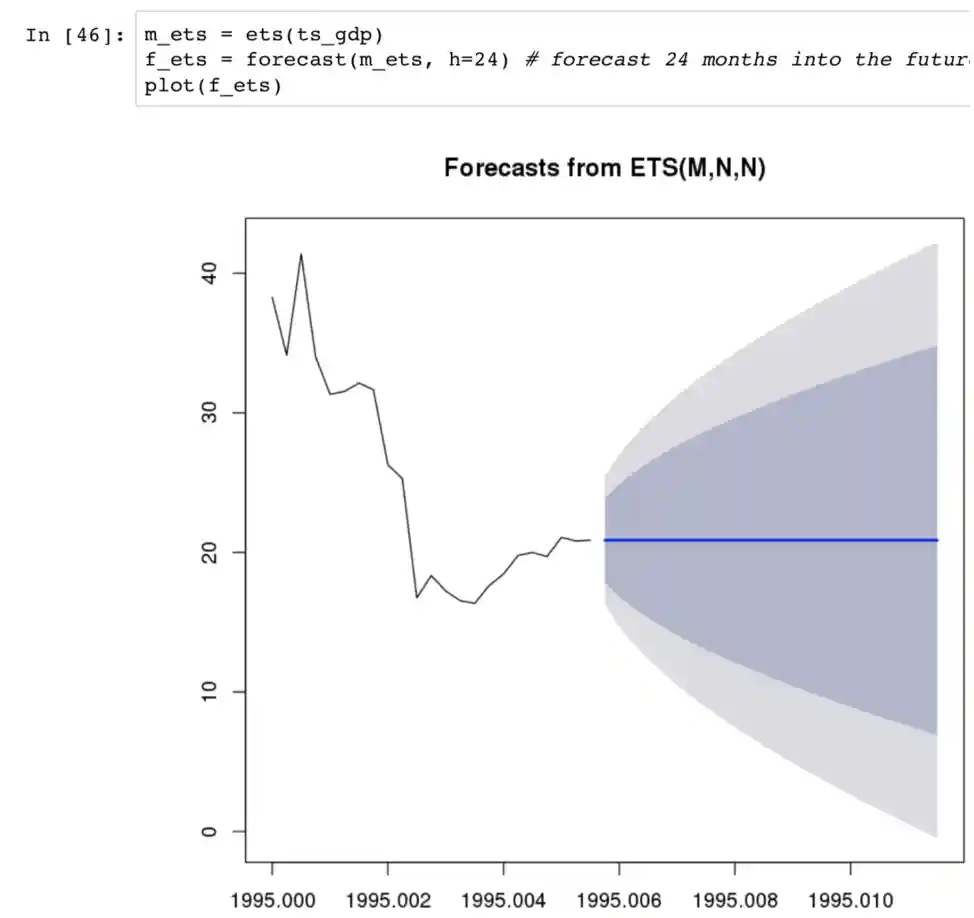
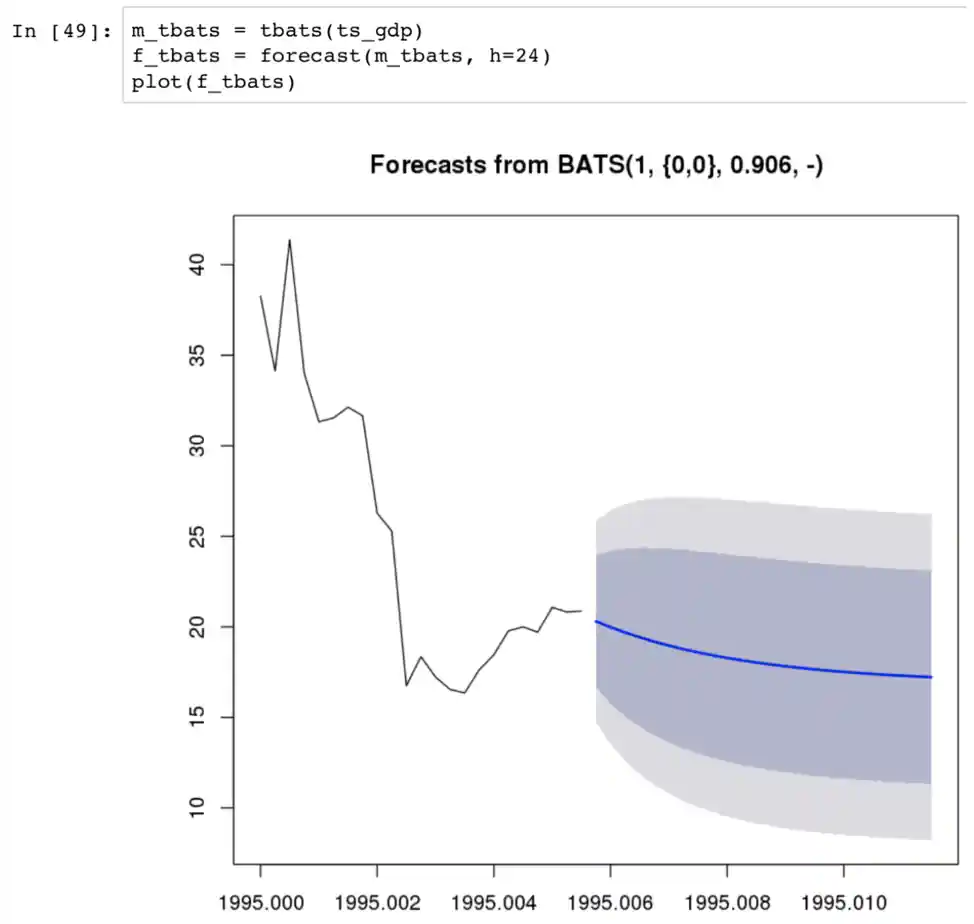
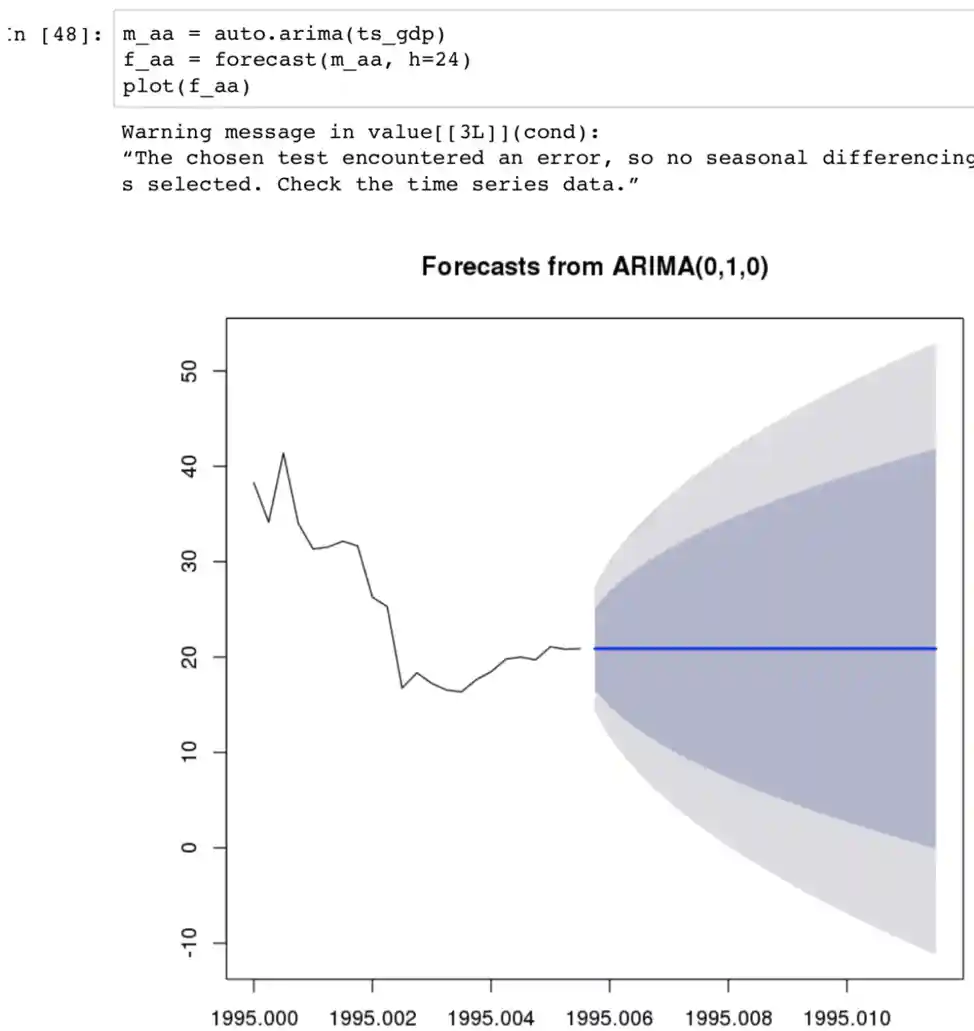
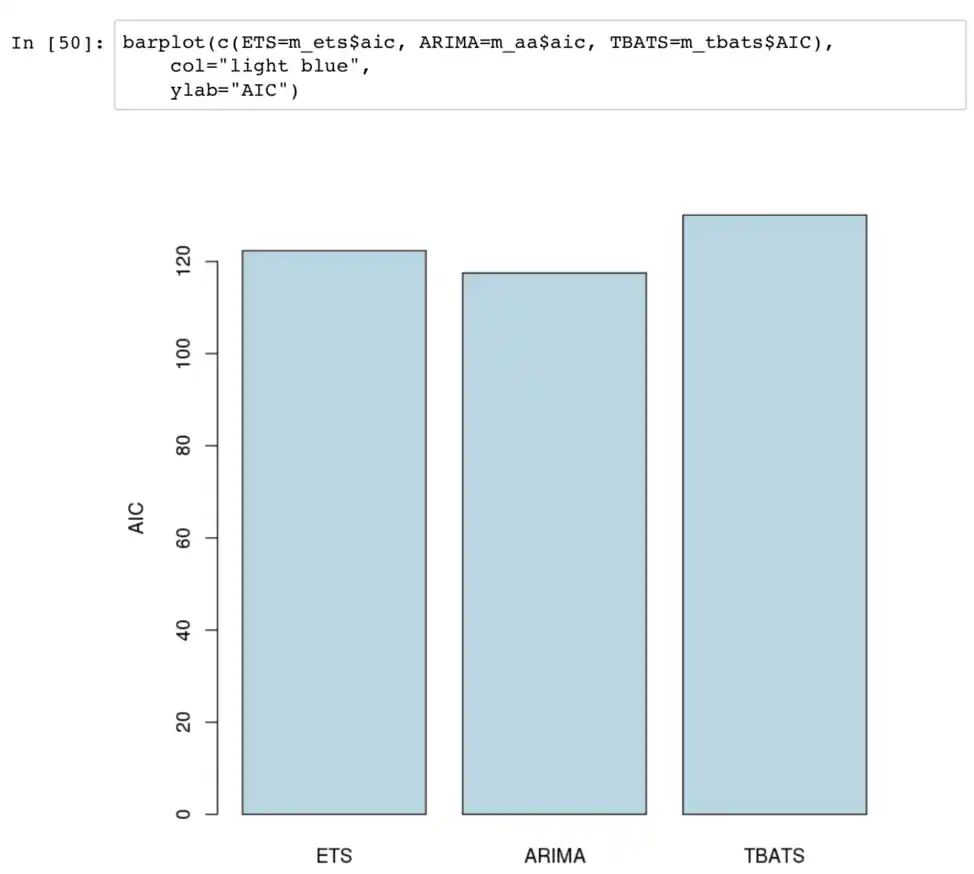
Using R statistical programming language extensions within the DataIku DSS platform, GDP data was loaded, plotted and processed using three common artificial intelligence predictive models for time series data. The error, trend, seasonality (ETS), transformation, autoregressive, moving average, errors, trend and seasonal components (TBATS) and autoregressive (AR) integrated moving average (ARIMA) models were used to forecast forward looking 24 months of GDP contributions for against U.S. GDP data. Finally, the Akaike information criterion (AIC) was used to cross validate the efficacy of the ETS, TBATS and ARIMA models as seen in Appendix B.The ARIMA model is a classic method of time series analysis. The model was first proposed by Box-Jenkins in 1976 and is represented as a moving average (MA) model combined with an AR model to fit the temporal dependence structure of a time series using the shift and lag of historical information (Kundu & Mukhopadhyay, 2016).
Discussion
The use of multiple tools proved necessary for the successful cleansing, normalization, preparation and analysis of GDP data. The time and quality of complex data management, processing and analysis using a single data science tool such as RStudio would have placed severe limitations on the size, complexity and skills required by a data analyst jeopardizing this research. Familiar tools such as Microsoft Excel, which are deceivingly powerful without being overly complex are a necessity for any data science toolbox. Taking advantage of newer decision support systems (DSS) such as DataIku’s DSS platform, also proved both approachable, as well as powerful to process vast amounts of data through in-memory analytics and ML algorithms. DSS platforms such as DataIku’s offer critical features for data science teams that including project collaboration, integration with continuous development software development pipelines, a wide array of data source connectivity options, data wrangling, data mining, machine learning and data visualizations (DataIku, 2018). When used to complement DSS, R programming can and did prove to be a powerful tool for point use cases, such as the GDP predictions from this research.
ARIMA forecasting proved to be the most accurate of those selected, possibily due to the granularity of the data at 1-year increments. Both the ETS and TBATS models are generally better predictors of trends that incur seasonality (De Livera, Hyndman & Snyder, 2010), which are not indicative of this data set.
Tying back the intent of this research to the economic sustainability of SIDEs. The analysis of 22 years of normalized time series data detailing the percent of GDP contributed by the T&T industry of 176 countries proved to show a reasonable statistical forecast of stable GDP contributions from the T&T industry.
Future Research
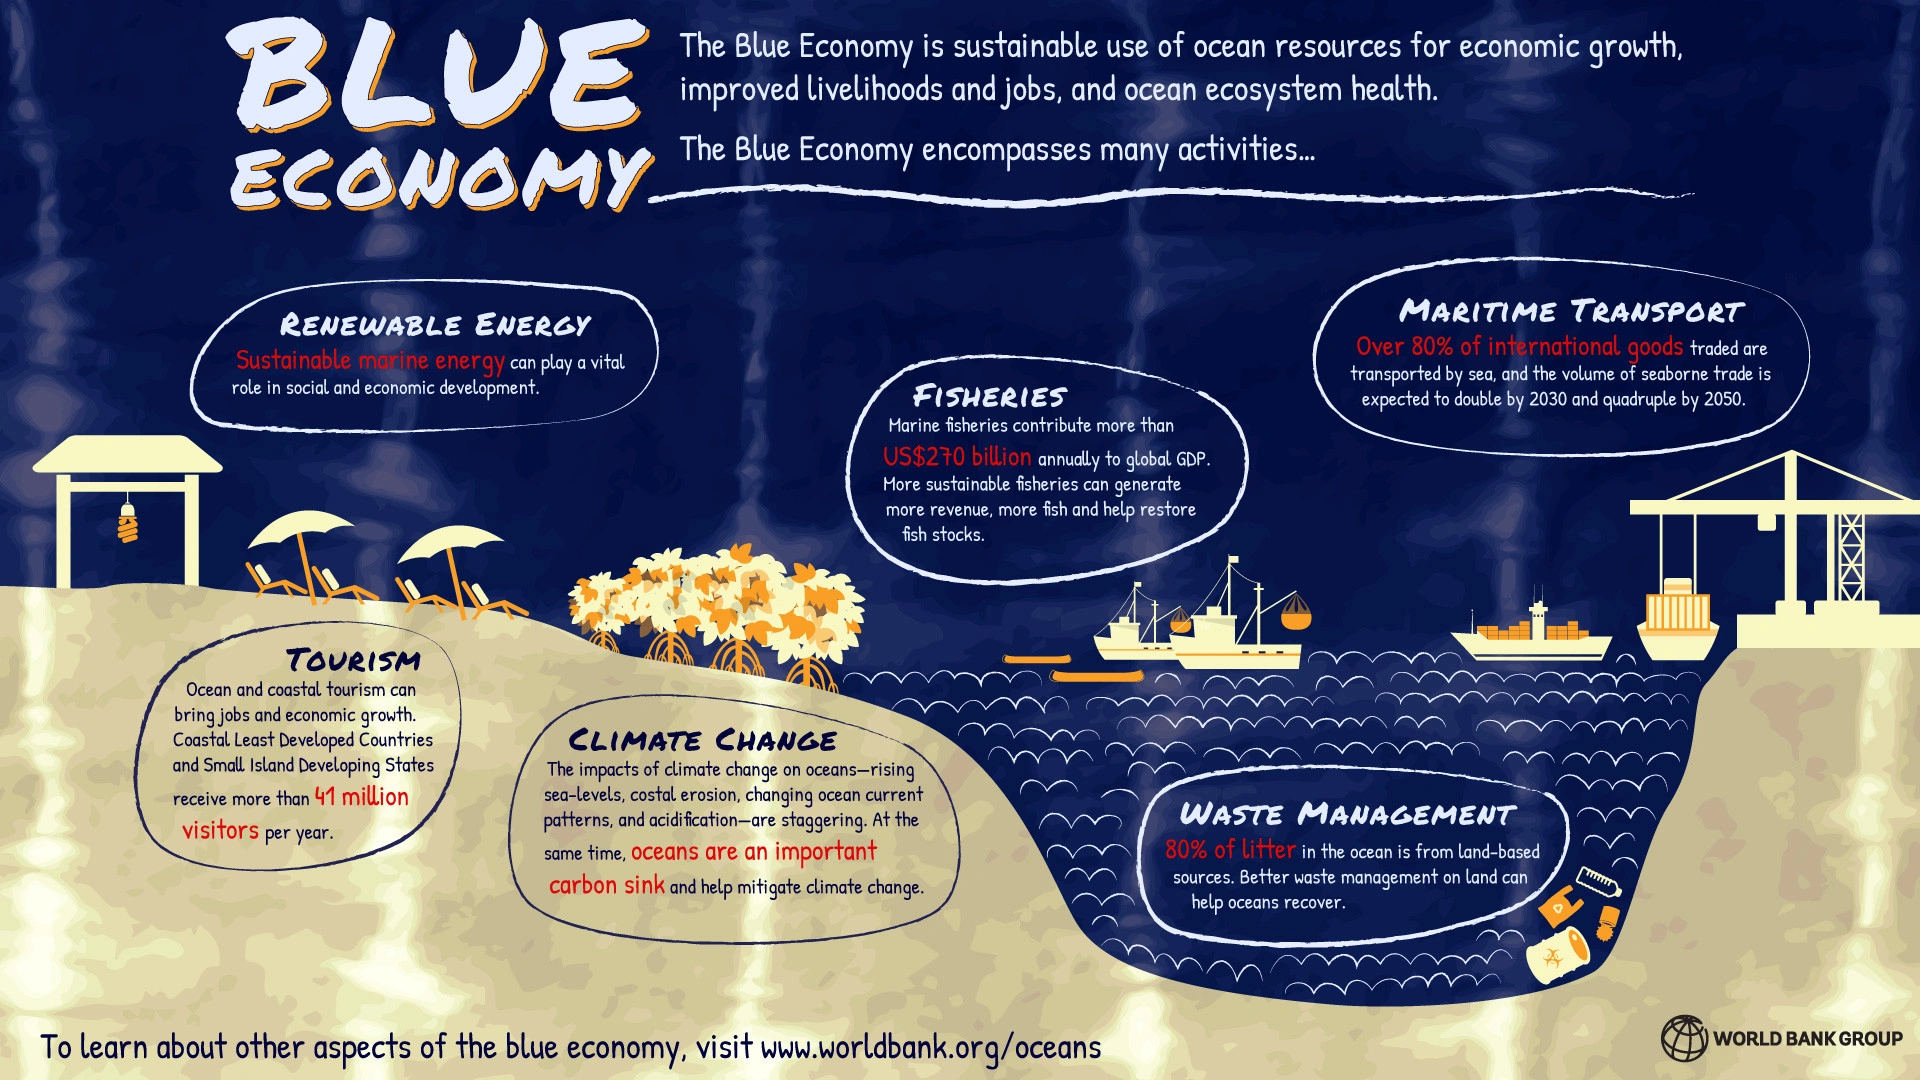
Future research may be warranted around on SIDE nations may not only participate in the 4IR, but use their dearth of resources as a source of strength, generating a new Blue Economy and leading the world forward in a sustainable way.
References
Barbara, V. T. (2005). Small island developing states and international trade: Special challenges in the global partnership for development. Melbourne Journal of International Law, 6(2), 402-436. Retrieved from http://fir.tesu.edu:2052/docview/217510626?accountid=40921
Castle, N. (2017, July 13). Supervised vs. Unsupervised Machine Learning. Retrieved June 18, 2018, from https://www.datascience.com/blog/supervised-and-unsupervised-machine-learning-algorithms
DataIku. (2018). Collaborative Data Science Platform. Retrieved June 18, 2018, from https://www.dataiku.com/
De Livera, A. M., Hyndman, R. J., & Snyder, R. D. (2010, December). Forecasting time series with complex seasonal patterns using exponential smoothing[Scholarly project]. In Rob J Hyndman. Retrieved June 18, 2018, from https://robjhyndman.com/papers/ComplexSeasonality.pdf
Kundu, A., & Mukhopadhyay, C. K. (2016). CAPITAL ASSET PRICING MODEL AND INDIA STOCK MARKET WITH AUTOREGRESSIVE INTEGRATED MOVING AVERAGE MODEL.Delhi Business Review, 17(1), 97-114. Retrieved from https://fir.tesu.edu:2128/docview/1892984804?accountid=40921
Mcelroy, J. L., & Parry, C. E. (2010). The characteristics of small island tourist economies. Tourism and Hospitality Research, 10(4), 315-328. doi:http://fir.tesu.edu:2074/10.1057/thr.2010.11
Schwab, K. (2017). The fourth industrial revolution. New York: Currency.
The Comparative Economic Impact of Travel & Tourism. (2012, November). Retrieved August 13, 2016, from http://www.wttc.org/-/media/files/reports/benchmark-reports/the_comparative_economic_impact_of_travel__tourism.pdf
WEF. (2018). The World Economic Forum (WEF) Mission. Retrieved June 18, 2018, from https://www.weforum.org/about/world-economic-forum
WTTC. (2018). [The World Bank, World Travel and Tourism Council: Travel and Tourism total contribution to GDP]. Published raw data. Retrieved from https://tcdata360.worldbank.org/indicators/tnt.tot.contrib.gdp?country=USA&indicator=24695&viz=line_chart&years=1995,2028#
The World Bank. (2018). World Bank Group: Who We Are. Retrieved June 18, 2018, from http://www.worldbank.org/en/who-we-are
Appendix - A: Historical T&T Percent of GDP Contributions w/1Yr. Forecast
Appendix - B: U.S. T&T Percent of GDP - R Programming 24 Month Forecast
© 2022 Mesh Digital LLC, ALL RIGHTS RESERVED