A Digital Marketing Performance Metrics Primer for B2B Firms
A Digital Marketing Performance Metrics Primer for B2B Firms Why Track Actionable Digital Marketing Metrics?


Why Track Actionable Digital Marketing Metrics?
In a world where it's just too easy to get lost in the chaos of digital marketing and marketing technology (MarTech) choices......

Although a Business to Business (B2B) software as a service (SaaS) firm is the target for this article, it could effectively be a proxy for any subscription based, digital service or product provider. For assumption purposes, it’s assumed that the marketing metrics could be used to develop a marketing performance dashboard delivered for a Chief Marketing Officer (CMO), Chief Digital Officer (CDO) or other interested C-Suite executives. Middle management dashboards may contain only a subset of information and/or be at a more detailed level in a particular area of concentration when compared with the below recommended metrics.
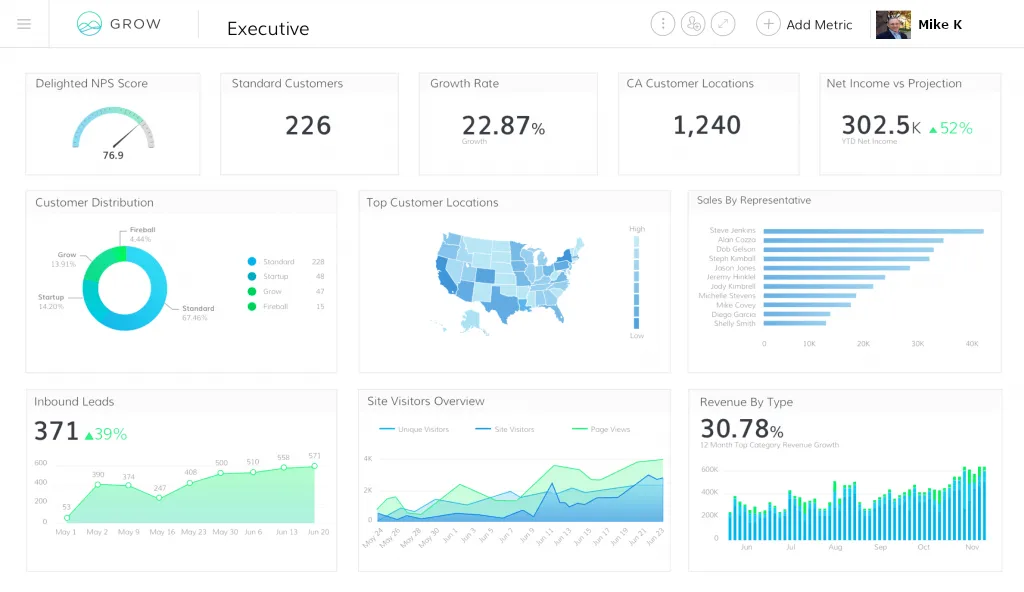
A B2B software as a service (SaaS) firm can benefit from using marketing dashboards to become a more efficient, transparent, and to level-set an organization that uses data to inform decisions on how to best use and conserve scarce resources such as capital and labor, rather than rely on gut instinct and judgement. These insights can yield improved resource allocations, the discovery of new trends and/or anomalies, improved forecasting, new or improved products, market entries or exits, improved strategic pricing and market differentiation, increased business agility, and better triaging of investments.
The below metrics are a good starting place for B2B firms to consider what to track, but by no means represents an all exhaustive list and consideration should be taken to tailor the right KPIs and metrics for each firm.

SaaS Digital Marketing Performance Key Performance Indicators (KPI)
Sales Performance Management KPI
- Total revenue YTD
- % Revenue Variance YOY YTD
- Monthly recurring revenue (MRR)
- New MRR
- Existing MRR
- Churn MRR
- % MRR Variance YOY this period
- % MRR Variance YOY last period
- Average revenue per account (ARPA) ($)
- Revenue by market
- % Revenue Variance YOY this period
- % Revenue Variance YOY last period
- Revenue by product
- % Revenue Variance YOY this period
- % Revenue Variance YOY last period
- Existing Markets Penetration %
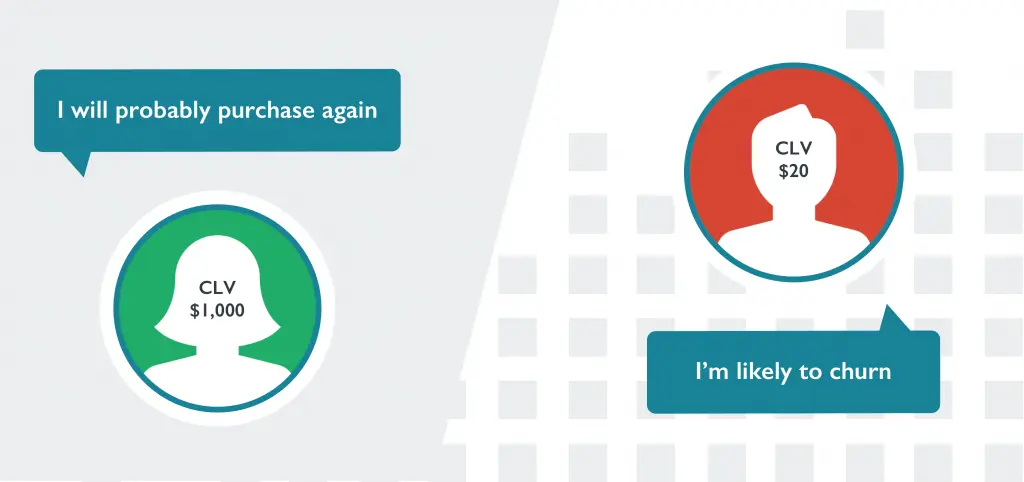
- Lifetime Value of Customers (LTV)
- % Variance this Q vs. prior Q
- Average contract value (ACV) ($)
- Average customer retention rate (time interval)
- % of Revenue from New Acquisition (Healy, Ledwith & O'Dwyer, 2014)
- Sales conversion rate (%)
- Average time to close
- % Variance this Q vs. prior Q
- Seasonally adjusted Gain/Loss
- Sales close rate (%) per Vertical Industry
- Average time to close
- % Variance this Q vs. prior Q
- Seasonally adjusted Gain/Loss
- % of Sales Reps Meeting Quota this Period
- % Revenue Variance from New Acquisition YOY this period
- % Revenue Variance from New Acquisition YOY last period
- % of Deals Lost to Competition
- Average Size of Deal lost to Competition ($)
- % of Revenue from Existing Customers
- % Revenue from Existing Customers Variance YOY this period
- % Revenue from Existing Customers Variance YOY last period (Frost, 2017)
Customer Experience Management
- Net Promoter Score (NPS) (This Period)
- NPS YTD
- % Customer Churn
- Customer satisfaction rate (CSAT)
- Social Sentiment Scoring
- % Variance YOY this period
- % Variance YOY last period
- Touchpoints per communications channel
- % of CS service level agreements (SLA) met or exceeded
- Sales to service rate (%)
- Average Rate of Adoption (time to value)
- Upsell - Cross sell rate (%)
- % of Contract Renewals
- Customer Effort Score (CES) (Bough, Breuer, Fanderl, & Neher, 2017)
Marketing Efficiency Management
- % Marketing Spend to Revenue
- % Variance YOY this period
- % Variance YOY last period
- Monthly Burn Rate ($)
- Internal
- Agency
- Marketing Mix (%)
- Customer Acquisition Cost (CAC)
- CAC Per Channel
- Multi-Channel Outbound Campaigns (email, web, social)
- Event Marketing
- Content Marketing
- Social Marketing
- Search Engine Marketing
- Conversion Rate Per Channel (%)
- Top 3 Best Performing Channels
- Bottom 3 Worst Performing Channels
- Lifetime Value (LTV) to Customer Acquisition Costs (CAC) Ratio
- CAC Recovery Time (time)
- Monthly Average recurring revenue per customer (APR/Cust) (%) (Stafford, Lankton & Khoury, 2014)
- Return on Capital Employed (ROCE) per New Product
- Return on Sales (ROS) (Löfsten, 2014).
Value of the KPI Recommendations
These KPIs will give a holistic view to the performance and execution of sales effectiveness, campaign effectiveness, R&D effectiveness, product effectiveness and customer support of the business’ current state while grounding against historical performance. This information can then be used to provide business intelligence, informing where future strategies and investments are best served to continue to grow the business.
Using an example for each KPI category we can see how it's helpful in managing marketing and financial performance, as seen by tracking 1.) Sales: ARPA, existing customer sales penetration rates as a normalized percentage for the reporting period. 2.) Support: NPS used as a high level metric to interpret customer sentiment, measuring a customer’s willingness to recommend products and services to other similar customers. With B2B markets highly dependent on relationships, this metric also gives both a good indicator on how the firm is servicing and supporting its existing customers and the likelihood of them influencing future ones. 3.) Efficiency/ROI: CAC Recovery Time helps monitor how long it takes to recover the costs of acquiring a new customer, proving the efficiency of prospecting, converting, growing and maintaining customers.
Common Pitfalls to Avoid

In order to avoid common pitfalls with marketing dashboards a firm should ensure the following at a minimum as part of its marketing analytics program:
- The business value, setting broader goals for marketing dashboard(s) should be well defined.
- KPIs are clearly defined, actionable, and measurable.
- KPIs should be negotiated and socialized amongst interested stakeholders.
- Shared definitions of what the KPI measures and how they are derived needs to be negotiated amongst stakeholders, level setting the organization.
- The metrics and KPI tracked should be relatively comprehensive.
- The dashboard should be easy to use and available on multiple computing platforms (i.e. Computer, Mobile, etc.) and/or as printed presentations where appropriate.
- The dashboard(s) should perform quickly (Bauer, Fiedler, Jacobs & Spillecke, 2016).
- The data supporting the dashboard(s) needs to be up to date, and relevant.
- The data supporting the dashboard(s) needs to be of high quality, trusted, and consistent.
- Quantitative metrics should not replace qualitative observations, but rather inform them.
- Analytics, KPIs and metrics, should‘t get in the way of developing insights to the how and why some event has or should occur.
- Stakeholders shouldn’t get lost in the analytics, forgetting to put the customer or colleague first.
- Understand that the dashboards usefulness can be limited to showing macro variables and trends, but may not sufficiently unearth smaller, more focused issues or exceptions.
- Statistical analysis methods may smooth out exceptions, but exceptions to major B2B client’s could have material adverse effects on the firm.
- The right team and culture needs to be built around marketing analysis, analytics, and performance management with the appropriate governance and rewards program to reinforce it.
References
Bauer, T., Fiedler, L., Jacobs, J., & Spillecke, D. (2016, January). The secret to great marketing analytics? Connecting with decision makers. Retrieved November 19, 2017, from https://www.mckinsey.com/business-functions/marketing-and-sales/our-insights/the-secret-to-great-marketing-analytics-connecting-with-decision-makers
Bough, V., Breuer, R., Fanderl, H., & Neher, K. (2017, April). Four ways to shape customer-experience measurement for impact. Retrieved November 19, 2017, from https://www.mckinsey.com/business-functions/operations/our-insights/four-ways-to-s hape-customer-experience-measurement-for-impact
Frost, A. (2017). The Ultimate Guide to Sales Metrics: What to Track, How to Track It, & Why. Retrieved November 19, 2017, from https://blog.hubspot.com/sales/sales-metrics
Healy, B., Ledwith, A., & O'Dwyer, M. (2014). Perceptions of product advantage, NPD and organisational performance. Journal of Small Business and Enterprise Development, 21( 1), 49-68. Retrieved from https://fir.tesu.edu:2128/docview/1508275691?accountid=40921
McClary, R. V. (2006). AN EVALUATION OF CONSUMER BUYING CRITERIA AND ITS IMPACT ON THE PURCHASE OF COMMODITIZED LAPTOPS( Unpublished master's thesis). Capella University. Retrieved November 19, 2017, from http://www.drjimmirabella.com/dissertations/dissertation-rachelmcclary.pdf
Löfsten, H. (2014). Product innovation processes and the trade-off between product innovation performance and business performance.
European Journal of Innovation Management, 17(1), 61-84. doi:http://fir.tesu.edu:2074/10.1108/EJIM-04-2013-0034
PWC. (2017, January). 2016 US Total Retail: Key findings. Retrieved November 19, 2017, from https://www.pwc.com/us/en/consumer-markets/publications/2016-total-retail-survey- us/us-key-findings.html
Stafford, B., Lankton, S., & Khoury, N. (2014). How much value did you give away to close your last SaaS deal? Retrieved November 19, 2017, from https://www.mckinsey.com/business-functions/marketing-and-sales/our-insights/how- much-value-did-you-give-away-to-close-your-last-saas-deal
Statista. (2016). Average age of installed desktop PCs in U.S. 2016-2021 | Statistic. Retrieved November 19, 2017, from https://www.statista.com/statistics/267465/average-desktop-pc-lifespan/
© 2021 Mesh Digital LLC, ALL RIGHTS RESERVED